Motion in One Dimension PYQs · MHT CET · JEE Main · NEET
Graphs of Motion
Questions
36
MHT CET
7
JEE Main
24
NEET
5
Years
1992–2026
0 of 36 attemptedPick an answer to see the solution
Q1MHT CET 2026 · 13 APR · SHIFT 2Easy
Graphs of Motion · Velocity-time graphs: distance & displacement
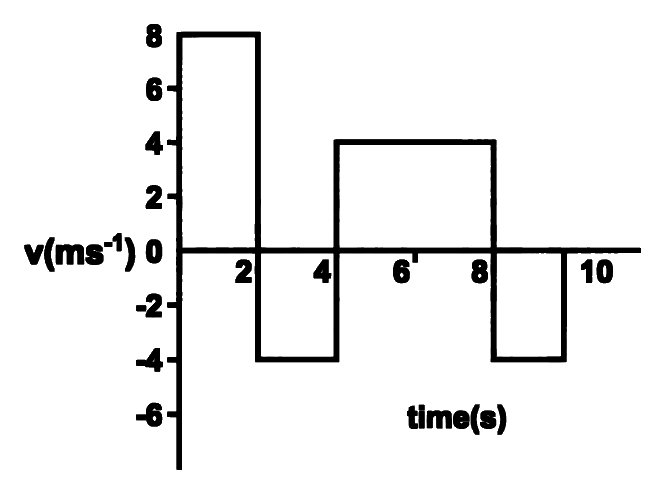
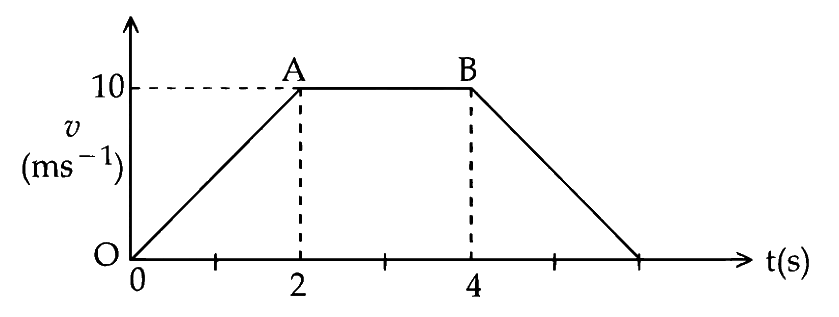
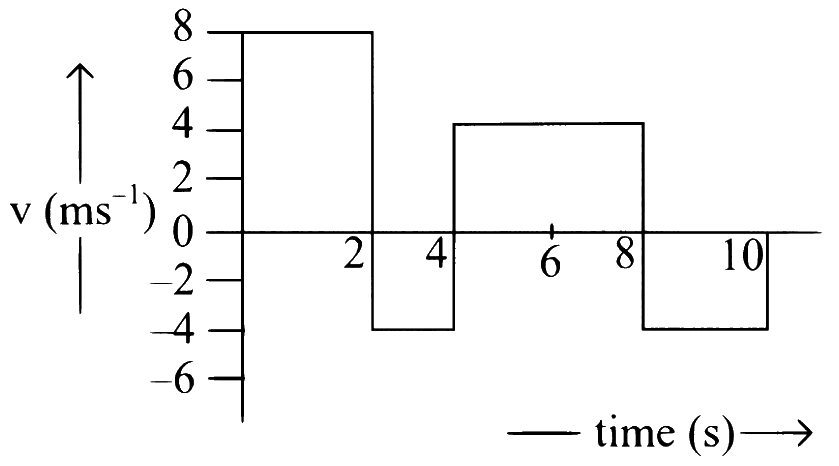
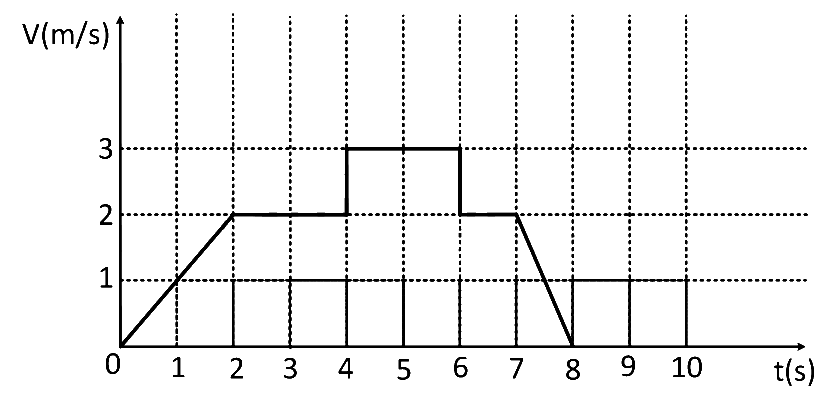
The velocity time graph of a body moving in a straight line is shown in a figure. The ratio of displacement to distance travelled by the body in time 0 to 10 s is
Graphs of Motion · Velocity-time graphs: distance & displacement
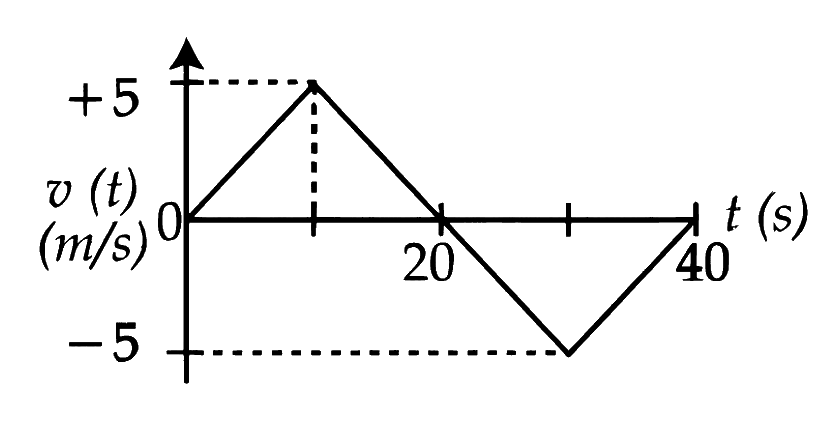
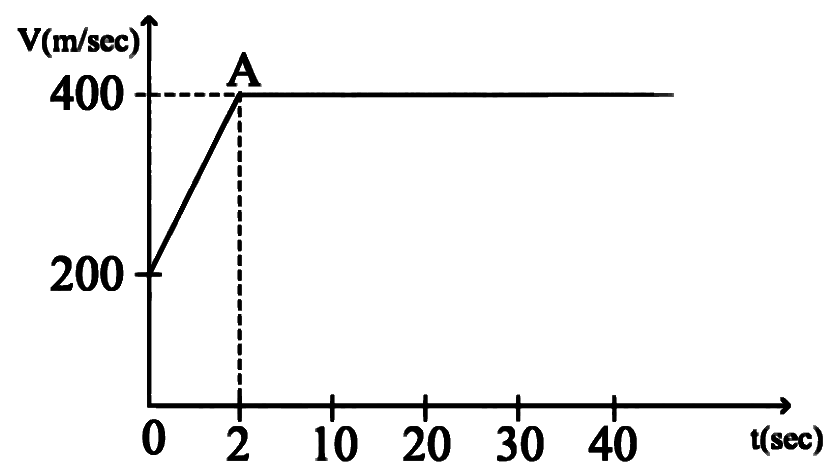
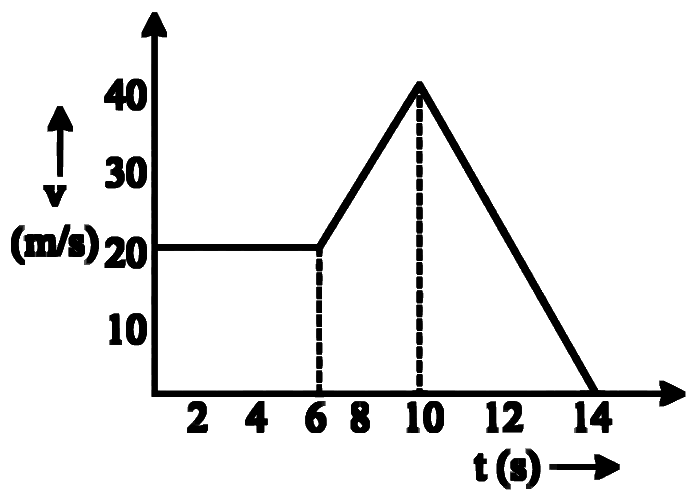
The velocity (v) versus time (t) plot of a particle is shown in the figure, for a time interval of 40 s. The total distance travelled by the particle and the average velocity during this period are, respectively
Graphs of Motion · Velocity-time graphs: distance & displacement
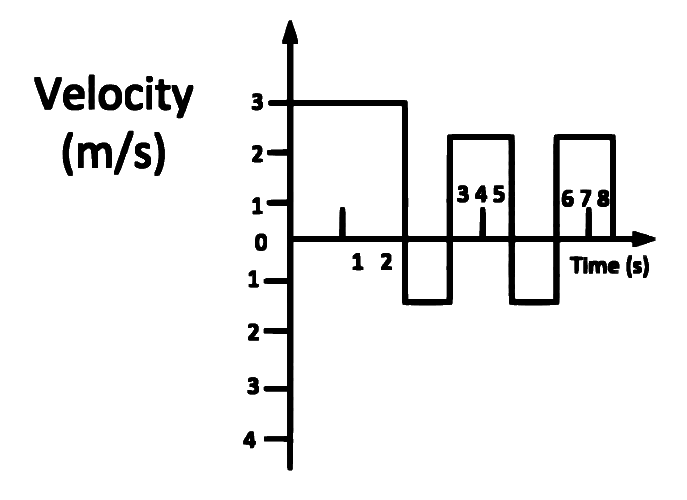
The velocity time graph of a body moving in a straight line is shown in figure. The ratio of displacement to distance travelled by the body in time 0 to 8 s is
Graphs of Motion · Velocity-time graphs: distance & displacement
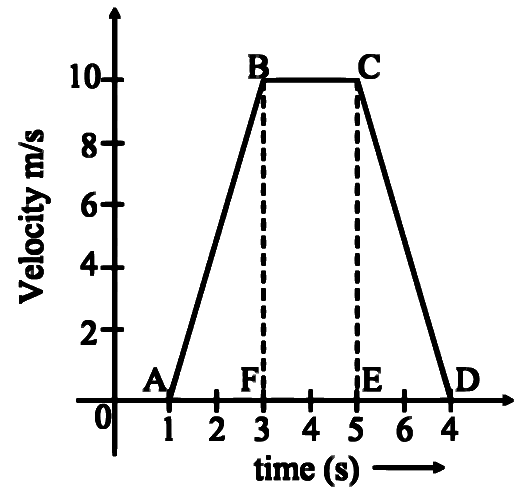
The velocity-time graph of an object moving along a straight line is shown in the figure. What is the distance covered by the object between t=0 to t=4 s?
Graphs of Motion · Velocity-time graphs: distance & displacement
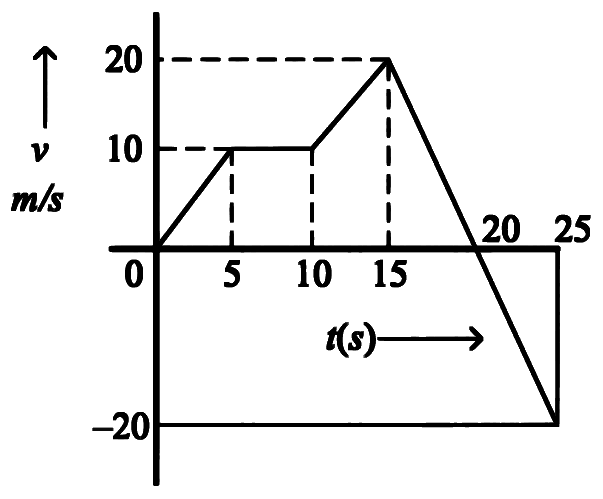
The motion of an airplane is represented by velocity-time graph as shown below. The distance covered by airplane in the first 30.5 second is ̱_______ km.
Graphs of Motion · Velocity-time graphs: distance & displacement
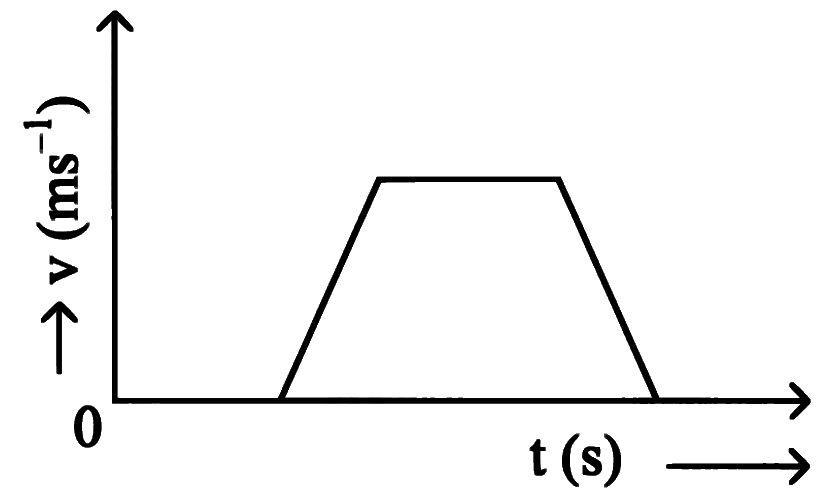
For the velocity-time graph shown in the figure below, the distance covered by the body in last two second of its motion is ' S1 '. What is the ratio of ' S1 ' to the total distance covered by it
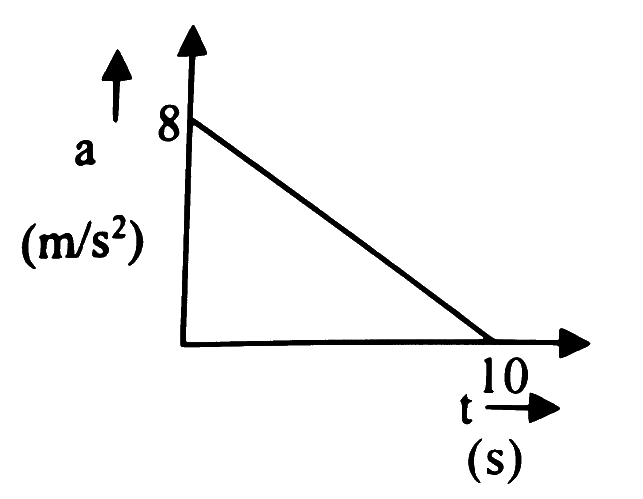
Graphs of Motion · Velocity-time graphs: slope, a-t graphs
Given below are two statements
Statement I: Area under velocity- time graph gives the distance travelled by the body in a given time. Statement II: Area under acceleration- time graph is equal to the change in velocity in the given time.
In the light of given statements, choose the correct answer from the options given below.
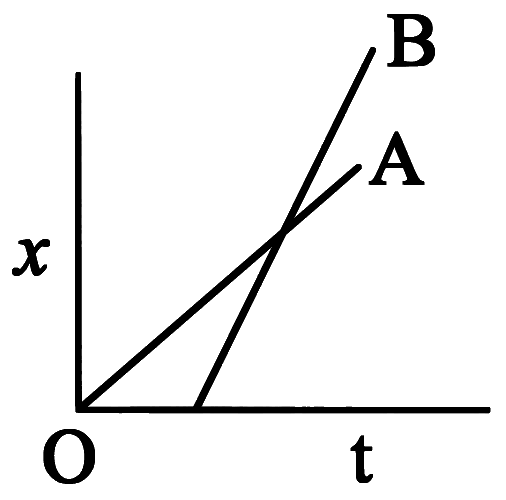
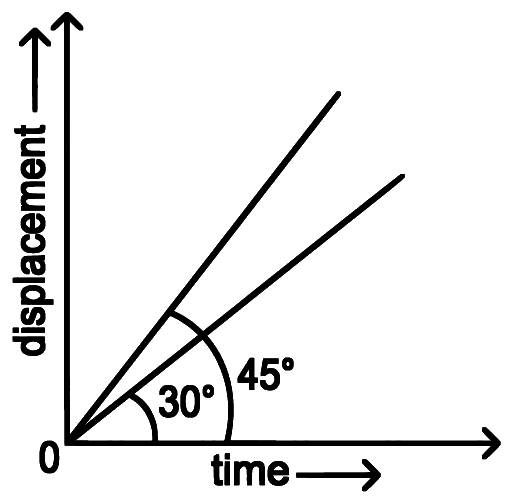
The displacement-time graphs of two moving particles make angles of 30∘ and 45∘ with the x-axis as shown in the figure. The ratio of their respective velocity is
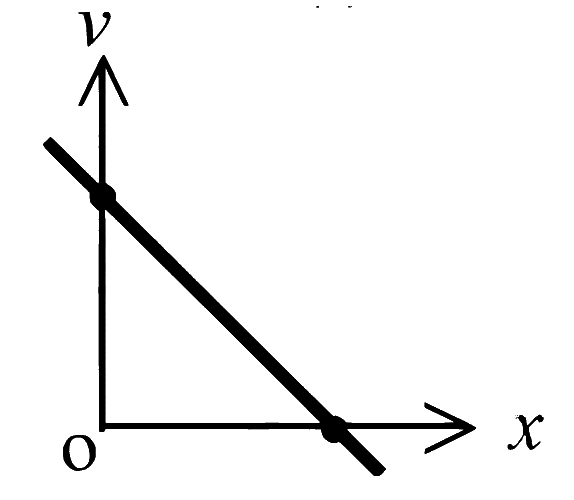
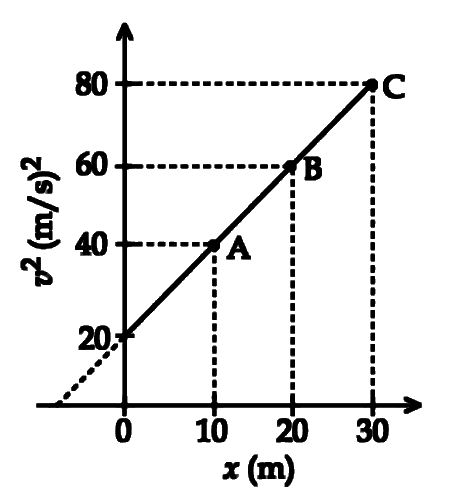
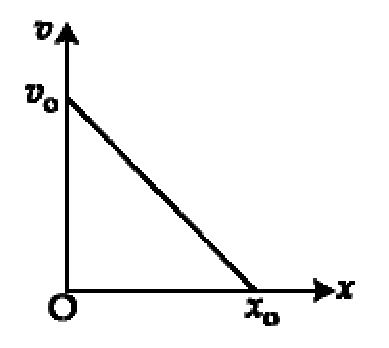
A particle is moving with constant acceleration 'a'. Following graph shows v2 versus x(displacement) plot. The acceleration of the particle is ___________ m/s2.
Numerical answer type. Work it out, then open the answer.
Graphs of Motion · Velocity-time graphs: distance & displacement
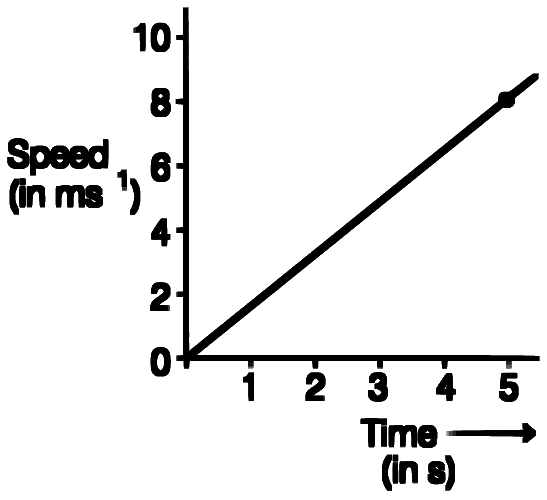
The speed versus time graph for a particle is shown in the figure. The distance travelled (in m) by the particle during the time interval t = 0 to t = 5 s will be________.
Numerical answer type. Work it out, then open the answer.
Graphs of Motion · Velocity-time graphs: distance & displacement
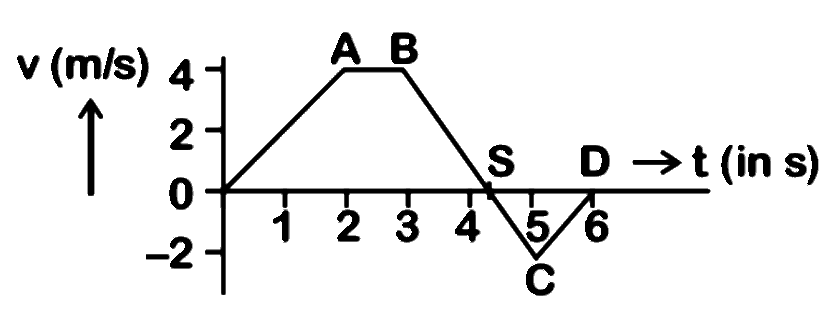
The velocity (v) and time (t) graph of a body in a straight line motion is shown in the figure. The point S is at 4.333 seconds. The total distance covered by the body in 6 s is:
Graphs of Motion · Velocity-time graphs: distance & displacement
A particle starts from the origin at time t = 0 and moves along the positive x-axis. The graph of velocity with respect to time is shown in figure. What is the position of the particle at time t = 5s?
Graphs of Motion · Identifying and matching graphs
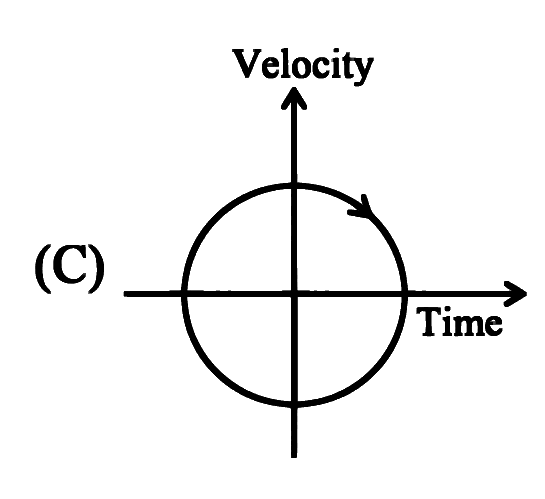
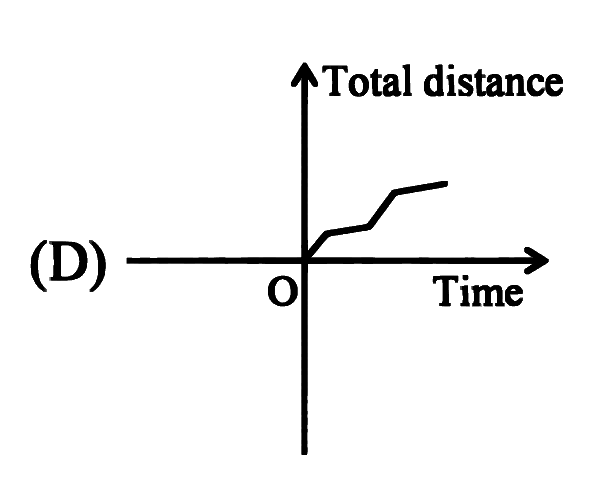
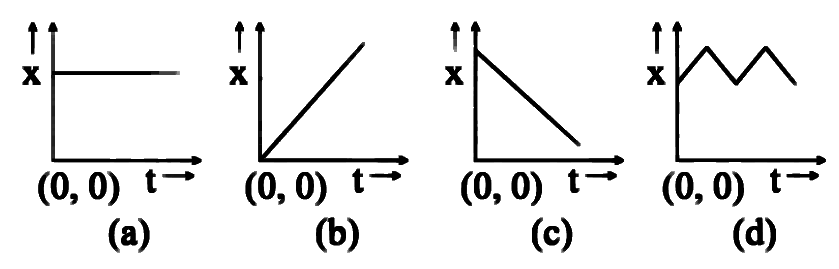
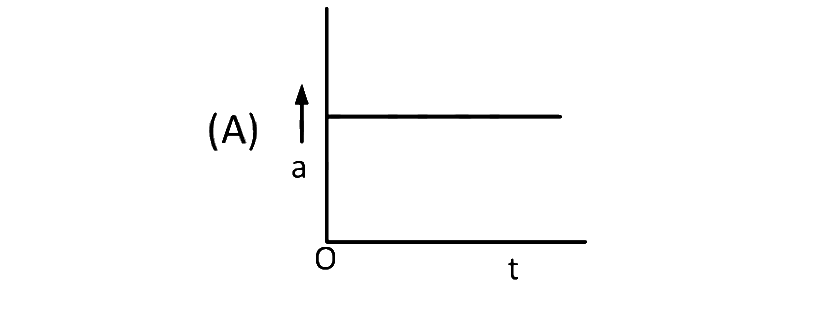
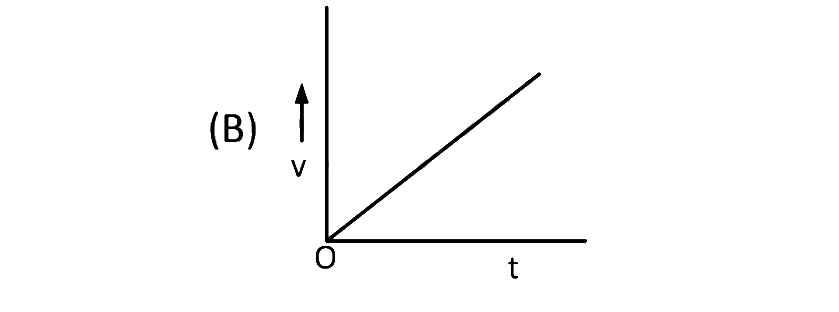
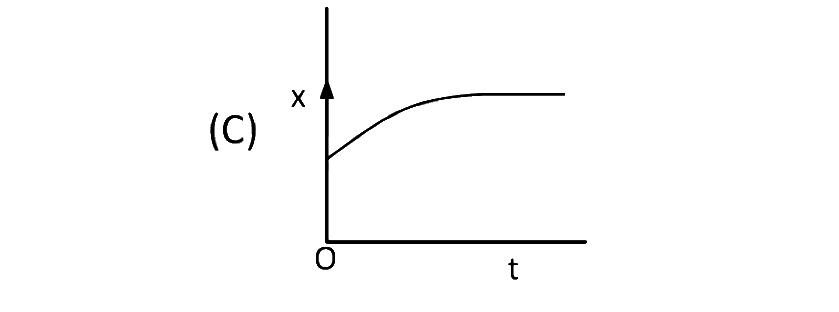
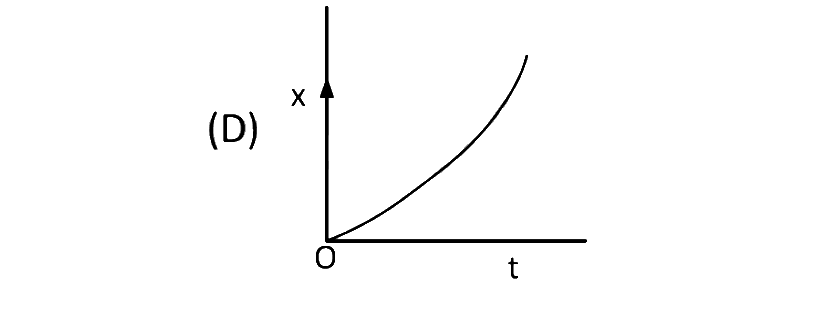
A particle starts from origin O from rest and moves with a uniform acceleration along the positive x- axis. Identify all figures that correctly represent the motion qualitatively. (a = acceleration, v = velocity, x = displacement, t = time)
Graphs of Motion · Velocity-time graphs: distance & displacement
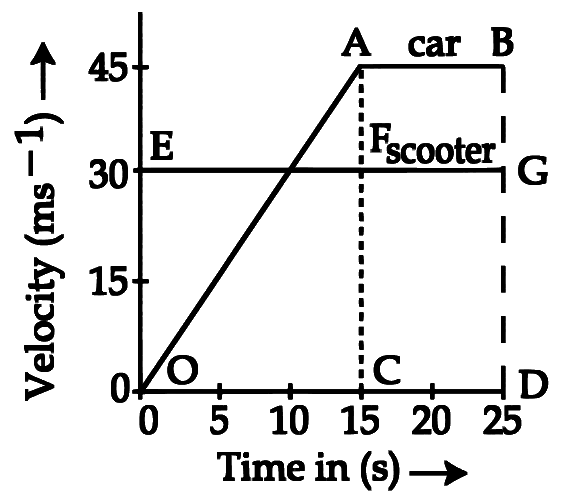
The velocity-time graphs of a car and a scooter are shown in the figure. (i) The difference between the distance travelled by the car and the scooter in 15 s and (ii) the time at which the car will catch up with the scooter are, respectively.
Graphs of Motion · Identifying and matching graphs
A body is at rest at x=0. At t=0, it starts moving in the positive x-direction with a constant acceleration. At the same instant another body passes through x=0 moving in the positive x direction with a constant speed. The position of the first body is given by x1(t) after time ’t’; and that of the second body by x2(t) after the same time interval. Which of the following graphs correctly describes (x1−x2) as a function of time ’t’?