0 of 87 attemptedPick an answer to see the solution
Q1MHT CET 2026 · 17 APR · SHIFT 2Easy
Photoelectric Experiment: Intensity, Stopping Potential & Graphs · Effect of intensity & frequency
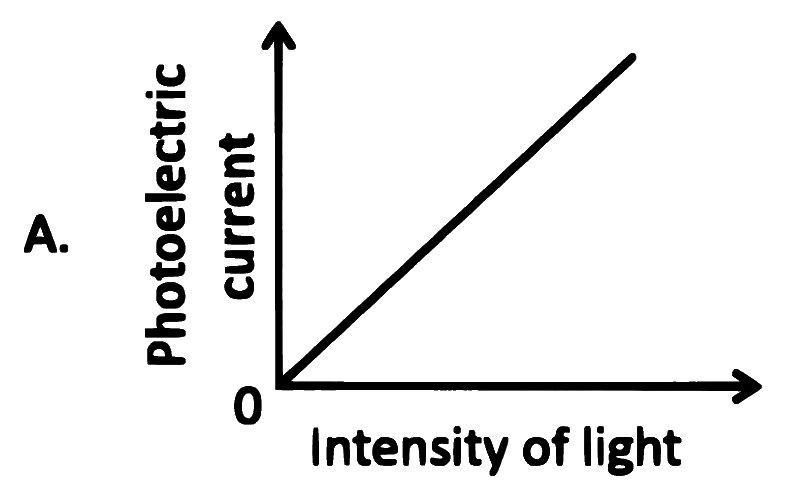
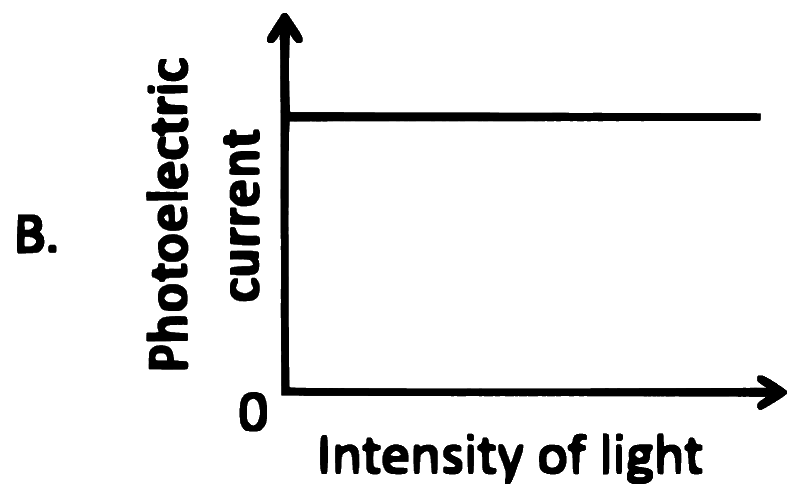
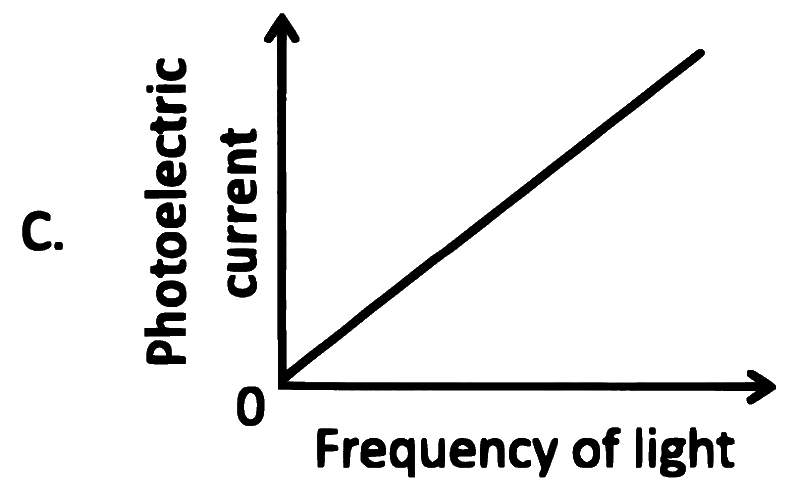
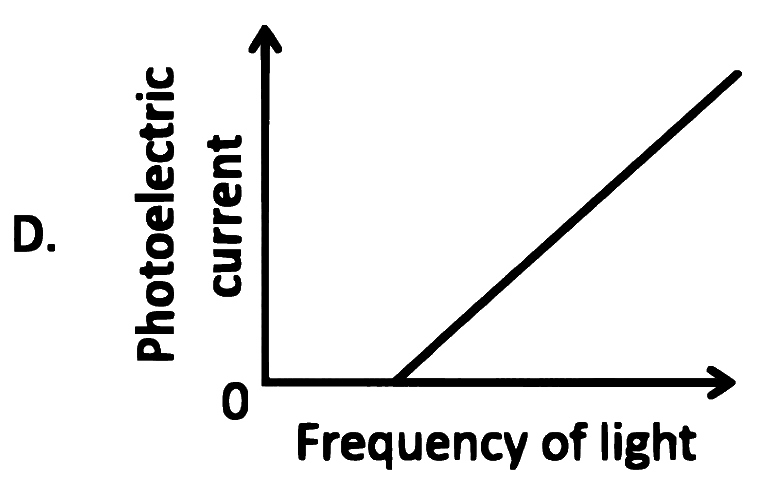
In photoelectric effect, keeping the frequency of incident radiation and accelerating potential fixed, if the intensity of incident light is increased,
Photoelectric Experiment: Intensity, Stopping Potential & Graphs · What stopping potential depends on
In photoelectric effect experiment, if the frequency of incident radiation (v) is increased, keeping all other factors constant, the stopping potential, ( v>v0) (v0 = threshold frequency)
Photoelectric Experiment: Intensity, Stopping Potential & Graphs · Graphs: stopping potential & KE vs frequency
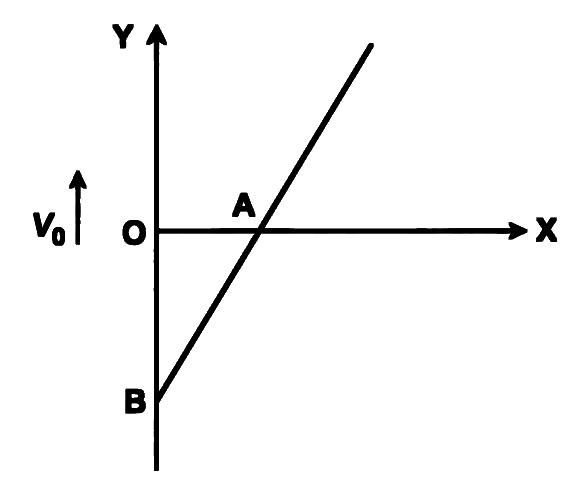
In an experiment on photoelectric effect, the stopping potential V0 is plotted against the frequency ν of the incident light. Considering e as the electronic charge, the work function of the photoelectric surface is given by
Photoelectric Experiment: Intensity, Stopping Potential & Graphs · Graphs: stopping potential & KE vs frequency
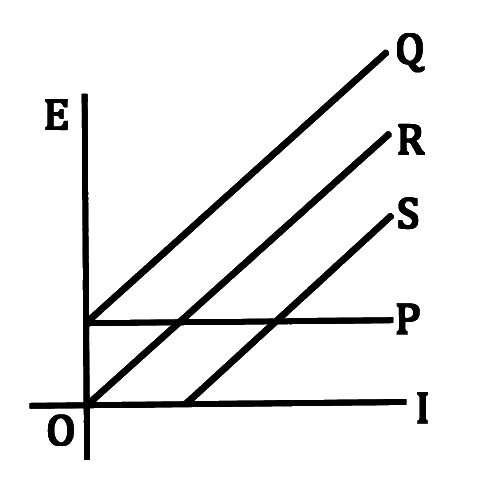
According to Einstein's photoelectric equation, the graph of the kinetic energy of the emitted photoelectrons versus the frequency of incident radiation gives a straight line whose slope
Photoelectric Experiment: Intensity, Stopping Potential & Graphs · Graphs: stopping potential & KE vs frequency
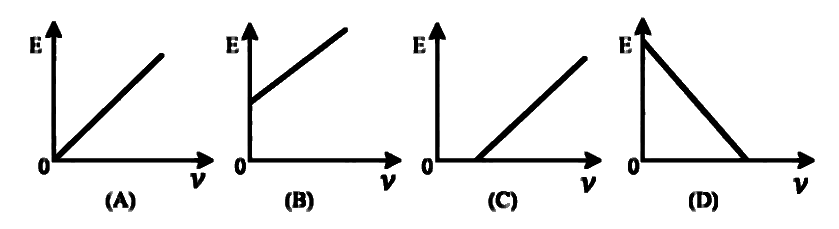
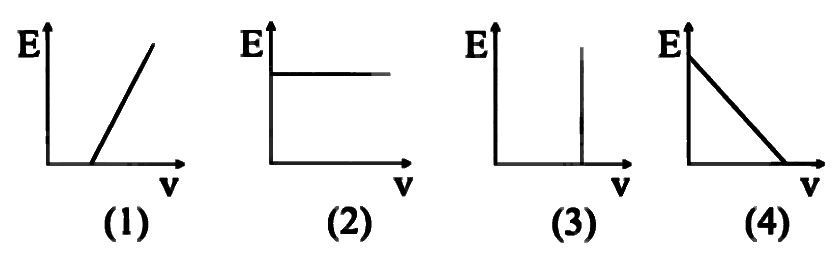
Using Einstein's photoelectric equation, the graphical representation between the kinetic energy (E) of emitted Photoelectrons and the frequency of incident radiation (ν) is show correctly in figure
Photoelectric Experiment: Intensity, Stopping Potential & Graphs · Graphs: stopping potential & KE vs frequency
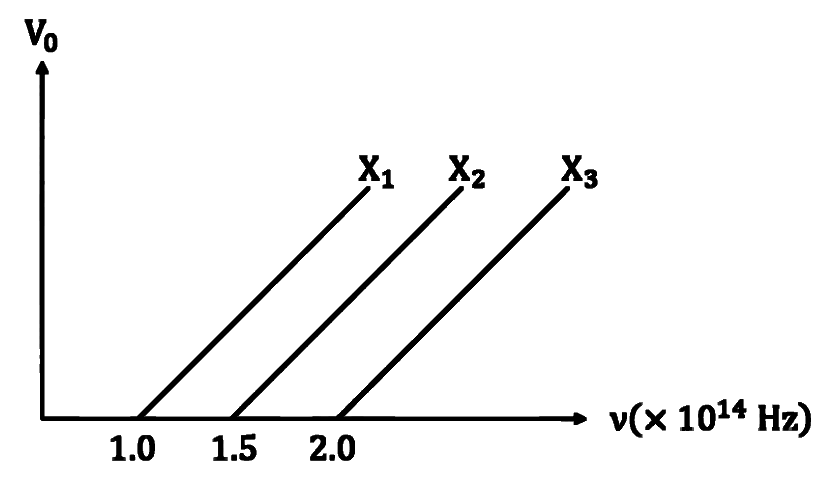
The graph shows variation of stopping potential Vo with the frequency v of the incident radiation for three photosensitive metals X1,X2 and X3. Which metal will give out electrons with greater kinetic energy, for the same wavelength of incident radiation?
Photoelectric Experiment: Intensity, Stopping Potential & Graphs · Effect of intensity & frequency
Light of incident frequency three times the threshold frequency is incident on a photo sensitive material. If the incident frequency is made (31)rd and intensity is doubled then photoelectric current will
A beam of light falls on a metal surface such that photo-electrons are generated. If power of the light source starts to decrease linearly with time t, then variation of the photocurrent I and magnitude of the stopping potential ∣V∣ with time is best represented by:
Photoelectric Experiment: Intensity, Stopping Potential & Graphs · Effect of intensity & frequency
In a photoelectric experiment, if the intensity of incident light is doubled and the frequency is kept slightly greater than threshold frequency, then the saturation photoelectric current
Photoelectric Experiment: Intensity, Stopping Potential & Graphs · Effect of intensity & frequency
Given below are two statements: one is labelled as Assertion A and the other is labelled as Reason R
Assertion A: In photoelectric effect, on increasing the intensity of incident light the stopping potential increases.
Reason R: Increase in intensity of light increases the rate of photoelectrons emitted, provided the frequency of incident light is greater than threshold frequency.
In the light of the above statements, choose the correct answer from the options given below
Photoelectric Experiment: Intensity, Stopping Potential & Graphs · Effect of intensity & frequency
Given below are two statements: one is labelled as Assertion (A) and the other is labelled as Reason (R).
Assertion (A): Emission of electrons in photoelectric effect can be suppressed by applying a sufficiently negative electron potential to the photoemissive substance.
Reason (R): A negative electric potential, which stops the emission of electrons from the surface of a photoemissive substance, varies linearly with frequency of incident radiation.
In the light of the above statements, choose the most appropriate answer from the options given below:
Photoelectric Experiment: Intensity, Stopping Potential & Graphs · Graphs: stopping potential & KE vs frequency
In photoelectric effect, the stopping potential (V0) v/s frequency (v) curve is plotted. ( h is the Planck's constant and ϕ0 is work function of metal)
(A) V0 v/s v is linear.
(B) The slope of V0 v/s v curve =hϕ0
(C) h constant is related to the slope of V0 v/s v line.
(D) The value of electric charge of electron is not required to determine h using the V0 v/s v curve. (E) The work function can be estimated without knowing the value of h.
Choose the correct answer from the options given below:
Photoelectric Experiment: Intensity, Stopping Potential & Graphs · Effect of intensity & frequency
Light of incident frequency 3 times the threshold frequency is incident on a photosensitive material. If the incident frequency is made (41)th and intensity is tripled then the photoelectric current will
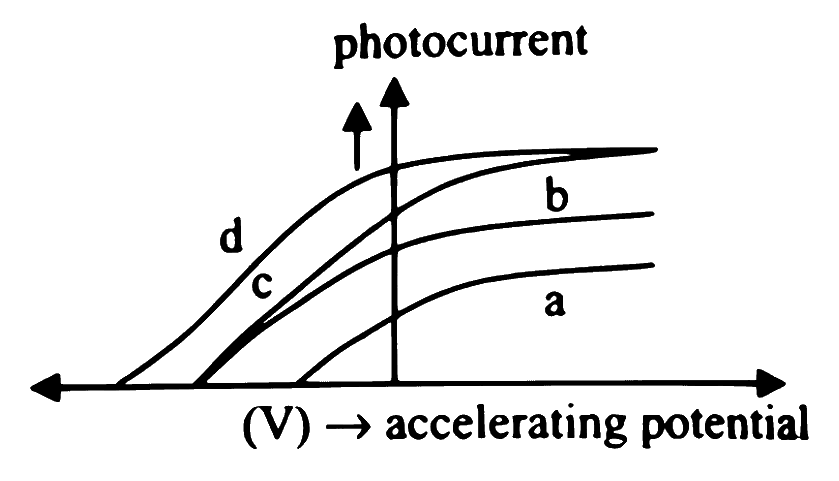
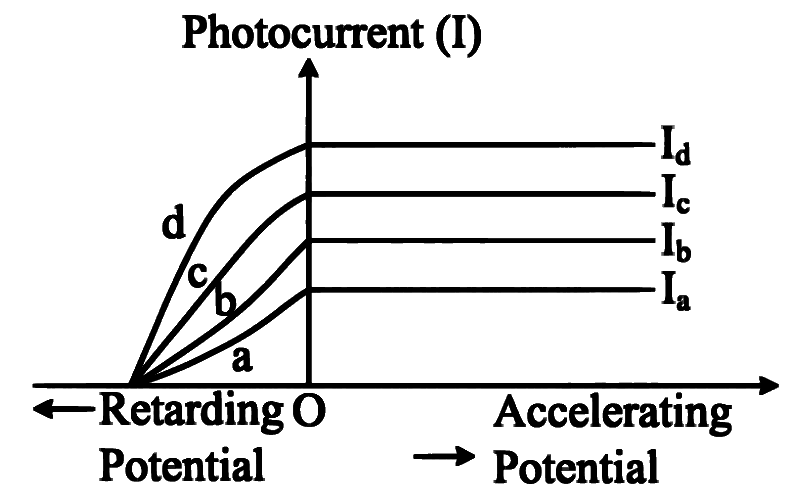
The graph shows the variation of photocurrent with anode potential for four different radiations. Let Ia,Ib,Ic and Id are intensities and fa,fb,fc and fd be the frequencies for the curves a,b,c and d respectively, then
Photoelectric Experiment: Intensity, Stopping Potential & Graphs · Graphs: stopping potential & KE vs frequency
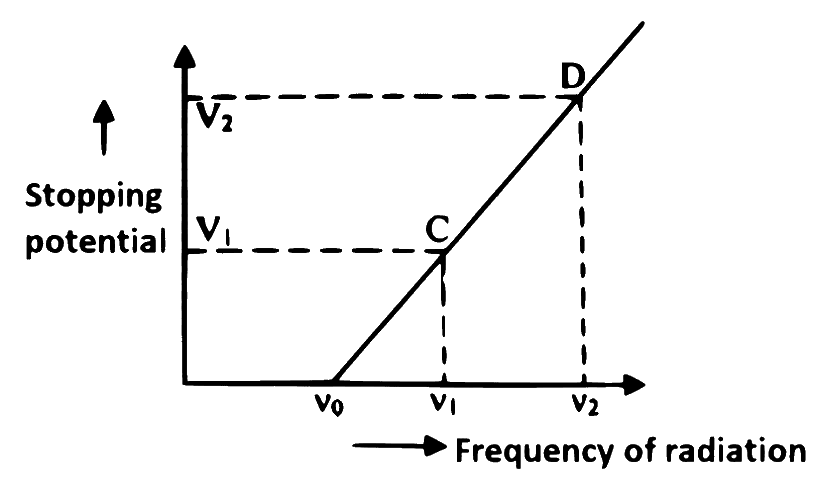
Graph shows variation of stopping potential with frequency of incident radiation on a metal plate. The value of Planck's constant is [ e= charge on photoelectron]
Photoelectric Experiment: Intensity, Stopping Potential & Graphs · Graphs: stopping potential & KE vs frequency
For two different photosensitive materials having work function ϕ and 2ϕ respectively, are illuminated with light of sufficient energy to emit electrons. If the graph of stopping potential versus frequency is drawn, for these two different photosensitive materials, the ratio of slope of graph for these two materials is
The figure shows the variation of photocurrent with anode potential for four different radiations. Let fa,fb,fc and fd be the frequencies for the curves a,b,c and d respectively
Which figure shows the correct variation of applied potential difference (V) with photoelectric current (I) at two different intensities of light (I1<I2) of same wavelengths:
Photoelectric Experiment: Intensity, Stopping Potential & Graphs · Graphs: stopping potential & KE vs frequency
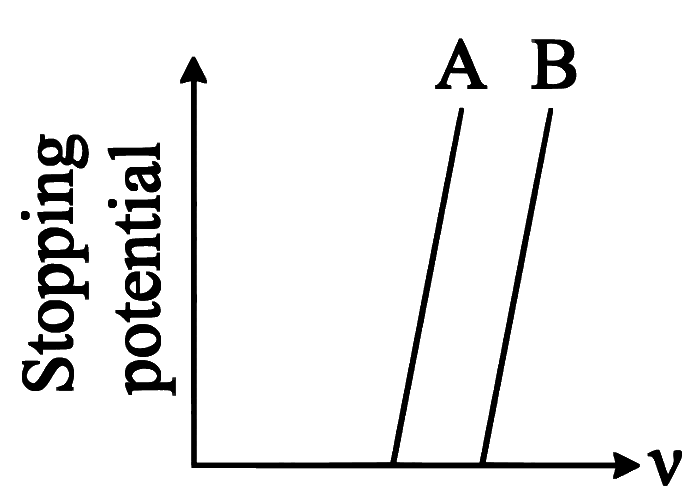
The stopping potential as a function of frequency of incident radiation is plotted for two different photoelectric surfaces A and B. The graph shows that the work function of A is
Photoelectric Experiment: Intensity, Stopping Potential & Graphs · Graphs: stopping potential & KE vs frequency
In case of photoelectric effect, the graph of measured stopping potential (V0) against frequency ' v ' of incident light is a straight line. The slope of this line multiplied by the charge of electron (e) gives
Photoelectric Experiment: Intensity, Stopping Potential & Graphs · Graphs: stopping potential & KE vs frequency
Using Einstein's photoelectric equation, the graph between kinetic energy of emitted photoelectrons and the frequency of incident radiation is shown correctly by graph
Photoelectric Experiment: Intensity, Stopping Potential & Graphs · Graphs: stopping potential & KE vs frequency
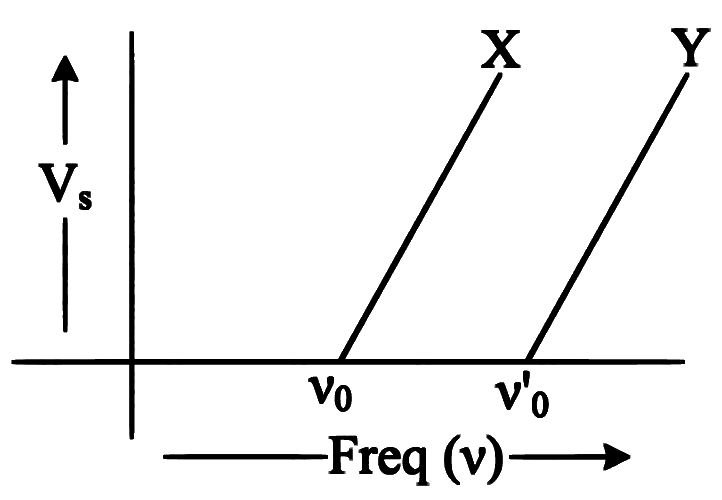
The graph of stopping potential ' Vs ' against frequency ' v ' of incident radiation is plotted for two different metals ' X ' and ' Y ' as shown in graph. ' ϕx ' and ' ϕy ' are work functions of ' x ' and ' Y ' respectively then
Photoelectric Experiment: Intensity, Stopping Potential & Graphs · Graphs: stopping potential & KE vs frequency
Given below are two statements:
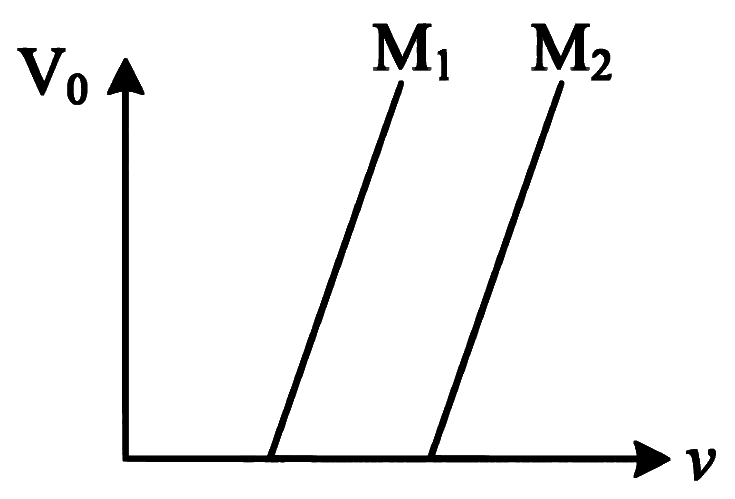
Statement I: Figure shows the variation of stopping potential with frequency (v) for the two photosensitive materials M1 and M2. The slope gives value of eh, where h is Planck's constant, e is the charge of electron.
Statement II: M2 will emit photoelectrons of greater kinetic energy for the incident radiation having same frequency.
In the light of the above statements, choose the most appropriate answer from the options given below.
Photoelectric Experiment: Intensity, Stopping Potential & Graphs · Graphs: stopping potential & KE vs frequency
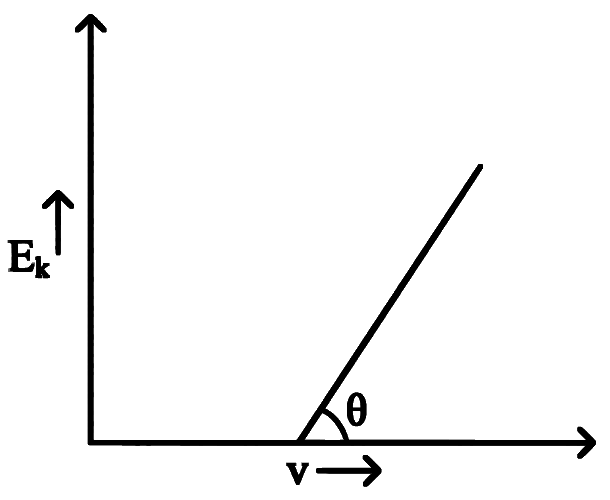
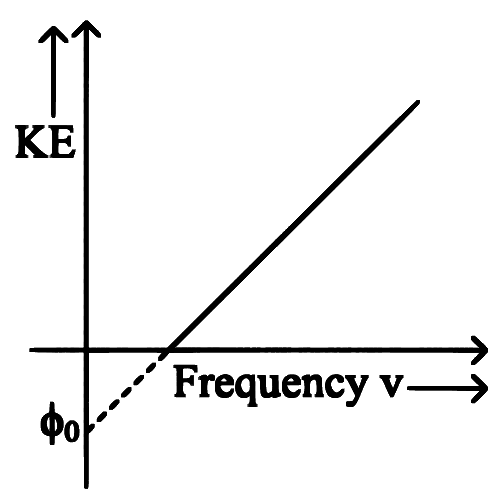
For the photoelectric effect, the maximum kinetic energy (Ek) of the photoelectrons is plotted against the frequency (v) of the incident photons as shown in figure. The slope of the graph gives
Photoelectric Experiment: Intensity, Stopping Potential & Graphs · Effect of intensity & frequency
In a photoelectric effect experiment a light of frequency 1.5 times the threshold frequency is made to fall on the surface of photosensitive material. Now if the frequency is halved and intensity is doubled, the number of photo electrons emitted will be:
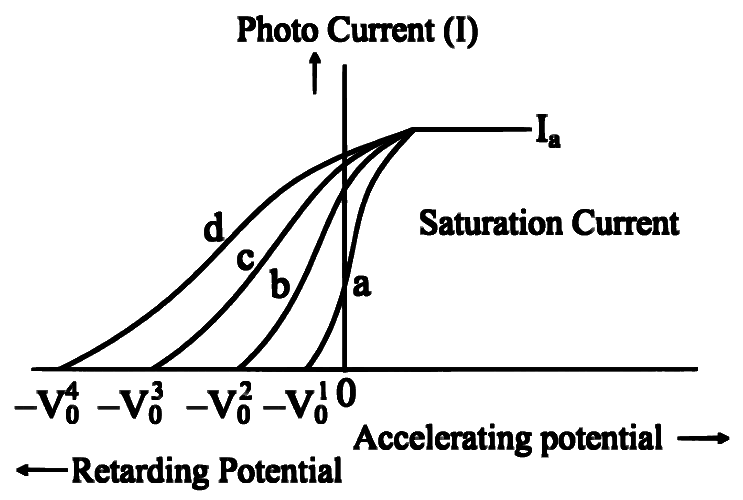
The figure shows the variation of photocurrent with anode potential for four different radiations. Let Ia,Ib,Ic and Id be the intensities for the curves a,b,c and d respectively [fa,fb,fc and fd are frequencies respectively]
Photoelectric Experiment: Intensity, Stopping Potential & Graphs · Effect of intensity & frequency
In photo electric effect
A. The photocurrent is proportional to the intensity of the incident radiation
B. Maximum Kinetic energy with which photoelectrons are emitted depends on the intensity of incident light.
C. Max. K.E with which photoelectrons are emitted depends on the frequency of incident light. D. The emission of photoelectrons require a minimum threshold intensity of incident radiation. E. Max. K.E of the photoelectrons is independent of the frequency of the incident light. Choose the correct answer from the options given below:
Photoelectric Experiment: Intensity, Stopping Potential & Graphs · Effect of intensity & frequency
From the photoelectric effect experiment, following observations are made. Identify which of these are correct.
A. The stopping potential depends only on the work function of the metal.
B. The saturation current increases as the intensity of incident light increases.
C. The maximum kinetic energy of a photo electron depends on the intensity of the incident light. D. Photoelectric effect can be explained using wave theory of light.
Choose the correct answer from the options given below:
Photoelectric Experiment: Intensity, Stopping Potential & Graphs · Graphs: stopping potential & KE vs frequency
The work functions of Aluminium and Gold are 4.1 eV and 5.1 eV respectively. The ratio of the slope of the stopping potential versus frequency plot for Gold to that of Aluminium is
Photoelectric Experiment: Intensity, Stopping Potential & Graphs · Effect of intensity & frequency
Light of frequency 1.5 times the threshold frequency is incident on photosensitive material. If the frequency is halved and intensity is doubled, the photocurrent becomes
Photoelectric Experiment: Intensity, Stopping Potential & Graphs · Effect of intensity & frequency
Given below are two statements:
Statement I: Out of microwaves, infrared rays and ultraviolet rays, ultraviolet rays are the most effective for the emission of electrons from a metallic surface.
Statement II: Above the threshold frequency, the maximum kinetic energy of photoelectrons is inversely proportional to the frequency of the incident light.
In the light of above statements, choose the correct answer form the options given below
Photoelectric Experiment: Intensity, Stopping Potential & Graphs · Graphs: stopping potential & KE vs frequency
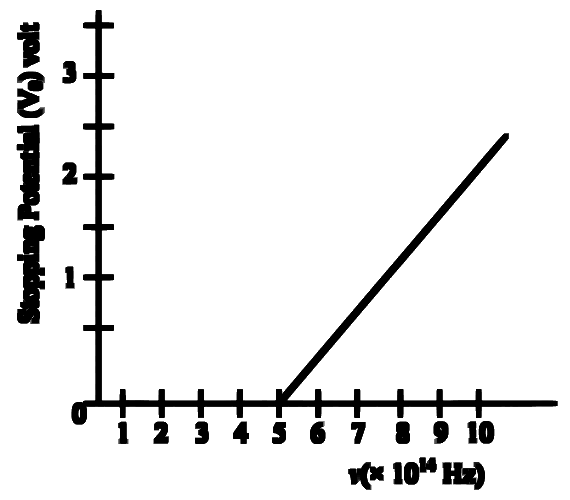
The variation of stopping potential (V0) as a function of the frequency (v) of the incident light for a metal is shown in figure. The work function of the surface is
Photoelectric Experiment: Intensity, Stopping Potential & Graphs · Effect of intensity & frequency
In photoelectric experiment keeping the frequency of incident radiation and accelerating potential fixed, if the intensity of incident light is increased,
Photoelectric Experiment: Intensity, Stopping Potential & Graphs · Effect of intensity & frequency
Light of frequency two times the threshold frequency is incident on photosensitive material. If the incident frequency is made (31)rd and intensity is doubled, then the photoelectric current will
Photoelectric Experiment: Intensity, Stopping Potential & Graphs · Graphs: stopping potential & KE vs frequency
In a photoelectric experiment, a graph of maximum kinetic energy (KEmax ) against the frequency of incident radiation (v) is plotted. If A and B are the intercepts on the X and Y axis respectively then the Planck's constant is given by
Photoelectric Experiment: Intensity, Stopping Potential & Graphs · Graphs: stopping potential & KE vs frequency
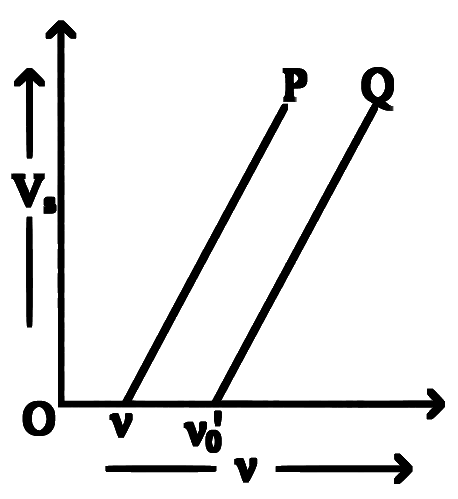
The graph of stopping potential Vs against frequency v of incident radiation is plotted for two different metals P and Q as shown in the graph. ϕp and ϕQ are work-functions of P and Q respectively, then
Photoelectric Experiment: Intensity, Stopping Potential & Graphs · Graphs: stopping potential & KE vs frequency
The graph of kinetic energy against the frequency v of incident light is as shown in the figure. The slope of the graph and intercept on X-axis respectively are
Photoelectric Experiment: Intensity, Stopping Potential & Graphs · Effect of intensity & frequency
Light of frequency 1.5 times the threshold frequency is incident on a photosensitive material. What will be the photoelectric current if the frequency is halved and intensity is doubled?
Photoelectric Experiment: Intensity, Stopping Potential & Graphs · Graphs: stopping potential & KE vs frequency
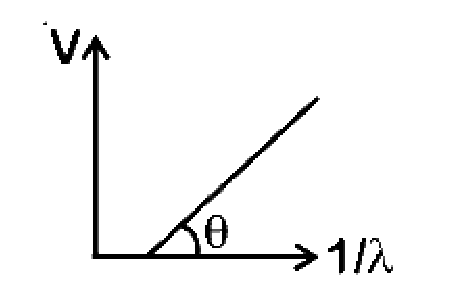
In a photoelectric effect experiment, the graph of stopping potential V versus reciprocal of wavelength obtained is shown in the figure. As the intensity of incident radiation is increased:
Photoelectric Experiment: Intensity, Stopping Potential & Graphs · Graphs: stopping potential & KE vs frequency
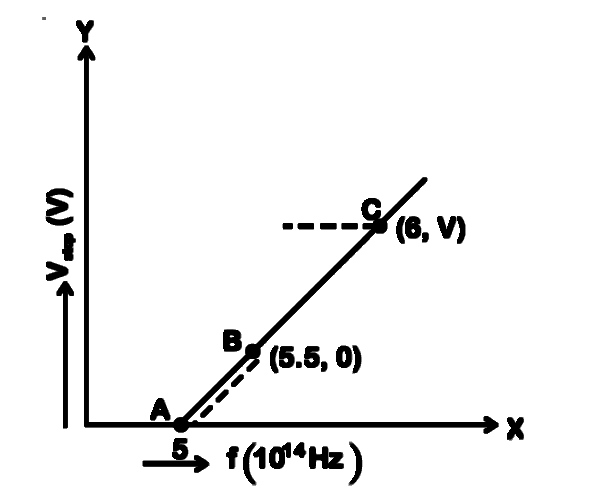
Given figure shows few data points in a photoelectric effect experiment for a certain metal. The minimum energy for ejection of electron from its surface is:
A beam of electromagnetic radiation of intensity 6.4 × 10⁻⁵ W/cm2 is comprised of wavelength, λ = 310 nm. It falls normally on a metal (work function ϕ = 2eV) of surface area of 1 cm2. If one in 103 photons ejects an electron, total number of electrons ejected in 1 s is 10x. (hc = 1240 eVnm, 1eV = 1.6 × 10⁻¹⁹ J), then x is _____.
Numerical answer type. Work it out, then open the answer.
Photoelectric Experiment: Intensity, Stopping Potential & Graphs · Effect of intensity & frequency
A metal surface is illuminated by light of given intensity and frequency to cause photoemission. If the intensity of illumination is reduced to one fourth of its original value then the maximum KE of the emitted photoelectrons would be
Photoelectric Experiment: Intensity, Stopping Potential & Graphs · Graphs: stopping potential & KE vs frequency
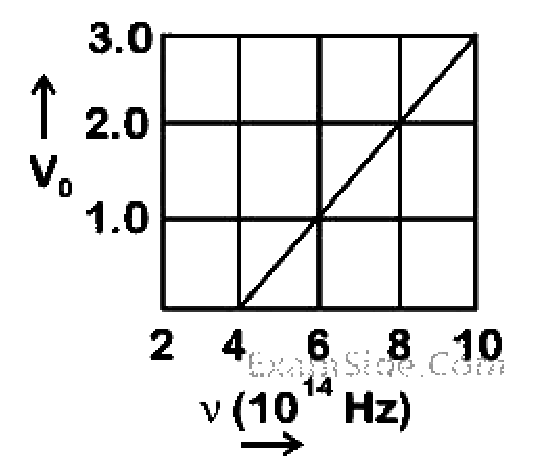
The stopping potential V0 (in volt) as a function of frequency (v) for a sodium emitter, is shown in the figure. The work function of sodium, from the data plotted in the figure, will be: (Given: Planck’s constant (h) = 6.63 × 10⁻³⁴ Js, electron charges e = 1.6 × 10⁻¹⁹ C)
A metal plate of area 1 × 10⁻⁴ m2 is illuminated by a radiation of intensity 16 mW/m2. The work function of the metal is 5 eV. The energy of the incident photons is 10 eV and only 10% of it produces photo electrons. The number of emitted photoelectrons per second and their maximum energy, respectively, will be
A beam of light has two wavelengths 4972 A˚ and 6216 A˚ with a total intensity of 3.6 × 10⁻³ Wm−2 equally distributed among the two wavelengths. The beam falls normally on an area of 1 cm2 of a clean metallic surface of work function 2.3 eV. Assume that there is no loss of light by reflection and that each capable photon ejects one electron. The number of photo electrons liberated in 2s is approximately:
Photoelectric Experiment: Intensity, Stopping Potential & Graphs · What stopping potential depends on
A source of light is placed at a distance of 50 cm from a photo cell and the stopping potential is found to be V0. If the distance between the light source and photo cell is made 25 cm, the new stopping potential will be:
The anode voltage of a photocell is kept fixed. The wavelength λ of the light falling on the cathode is gradually changed. The plate current I of the photocell varies as follows:
Photoelectric Experiment: Intensity, Stopping Potential & Graphs · Graphs: stopping potential & KE vs frequency
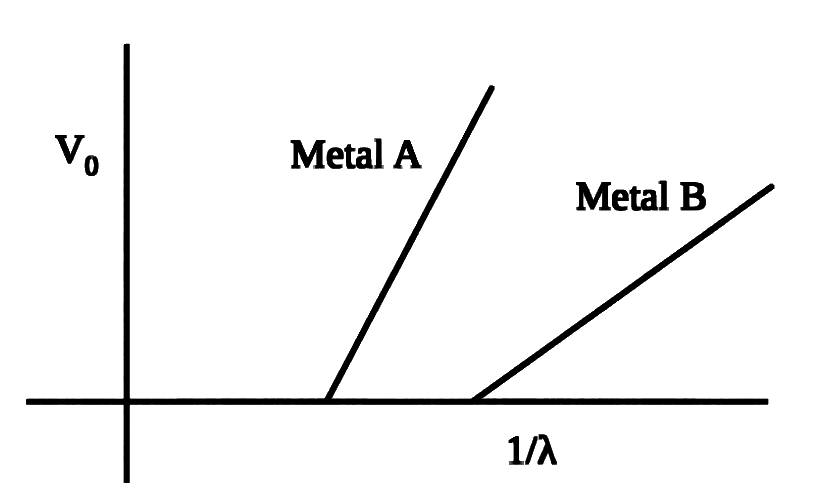
In an experiment on photoelectric effect, a student plots stopping potential V0 against reciprocal of the wavelength λ of the incident light for two different metals A and B. These are shown in the figure.
Looking at the graphs, you can most appropriately say that:
Photoelectric Experiment: Intensity, Stopping Potential & Graphs · What stopping potential depends on
This question has Statement - 1 and Statement - 2. Of the four choices given after the statements, choose the one that best describes the two statements.
Statement - 1: A metallic surface is irradiated by a monochromatic light of frequency v>v0 (the threshold frequency). The maximum kinetic energy and the stopping potential are Kmax and V0 respectively. If the frequency incident on the surface is doubled, both the Kmax and V0 are also doubled.
Statement - 2: The maximum kinetic energy and the stopping potential of photoelectrons emitted from a surface are linearly dependent on the frequency of incident light.
Photoelectric Experiment: Intensity, Stopping Potential & Graphs · Effect of intensity & frequency
When monochromatic radiation of intensity I falls on a metal surface, the number of photoelectrons and their maximum kinetic energy are N and T respectively. If the intensity of radiation is 2I, the number of emitted electrons and their maximum kinetic energy are respectively
Photoelectric Experiment: Intensity, Stopping Potential & Graphs · What stopping potential depends on
Statement - 1: When ultraviolet light is incident on a photocell, its stopping potential is V0 and the maximum kinetic energy of the photoelectrons is Kmax. When the ultraviolet light is replaced by X-rays, both V0 and Kmax increase.
Statement - 2: Photoelectrons are emitted with speeds ranging from zero to a maximum value because of the range of frequencies present in the incident light.
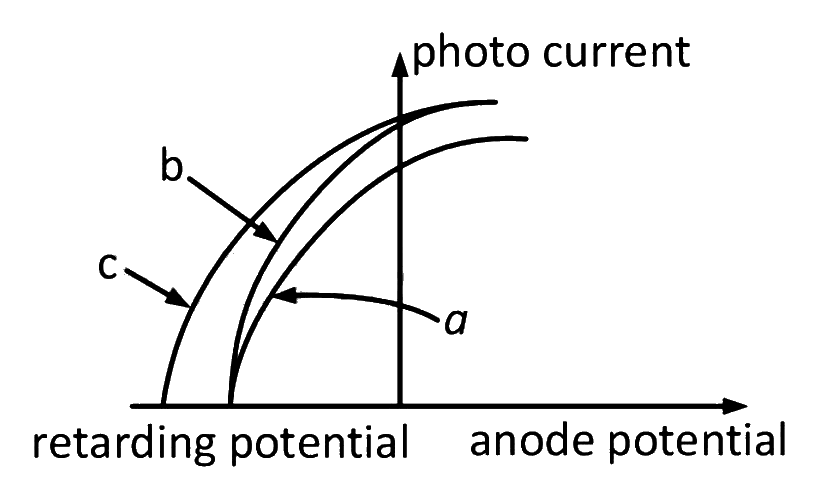
The figure shows a plot of photo current versus anode potential for a photo sensitive surface for three different radiations. Which one of the following is a correct statement?
Photoelectric Experiment: Intensity, Stopping Potential & Graphs · What stopping potential depends on
A 5 watt source emits monochromatic light of wavelength 5000 A˚. When placed 0.5 m away, it liberates photoelectrons from a photosensitive metallic surface. When the source is moved to a distance of 1.0 m, the number of photoelectrons liberated will be reduced by a factor of
The anode voltage of a photocell is kept fixed. The wavelength λ of the light falling on the cathode is gradually changed. The plate current I of the photocell varies as follows
A photocell is illuminated by a small bright source placed 1m away. When the same source of light is placed 21m away, the number of electrons emitted by photo-cathode would
Photoelectric Experiment: Intensity, Stopping Potential & Graphs · Graphs: stopping potential & KE vs frequency
According to Einstein's photoelectric equation, the graph between the kinetic energy of photoelectrons ejected and the frequency of incident radiation is
Photoelectric Experiment: Intensity, Stopping Potential & Graphs · Graphs: stopping potential & KE vs frequency
According to Einstein's photoelectric equation, the plot of the kinetic energy of the emitted photo electrons from a metal Vs the frequency of the incident radiation gives a straight line whose slope
A photo-cell is illuminated by a source of light, which is placed at a distance d from the cell. If the distance become d/2, then number of electrons emitted per second, will be
Photoelectric Experiment: Intensity, Stopping Potential & Graphs · Graphs: stopping potential & KE vs frequency
According to Einstein's photoelectric equation, the graph between the kinetic energy of photoelectrons ejected and the frequency of incident radiation is
Photoelectric Experiment: Intensity, Stopping Potential & Graphs · Effect of intensity & frequency
The cathode of a photoelectric cell is changed such that the work function changes from W1 to W2 (W2>W1 ). If the current before and after changes are I1 and I2, all other conditions remaining unchanged, then (assuming hν>W2)