
P-V Diagrams & Cyclic Processes
For any thermodynamic process, the work done by the system depends
Show answer and solution
Answer: (c)
Loading the solution…
Home›Practice Hub›Chapters›Thermodynamics›P-V Diagrams & Cyclic Processes
Thermodynamics PYQs · MHT CET · JEE Main · NEET
P-V Diagrams & Cyclic Processes
For any thermodynamic process, the work done by the system depends
Answer: (c)
P-V Diagrams & Cyclic Processes
Arrange the correct order of P-V diagrams in thermodynamics for an isothermal process, isobaric process, isochoric process and adiabatic process
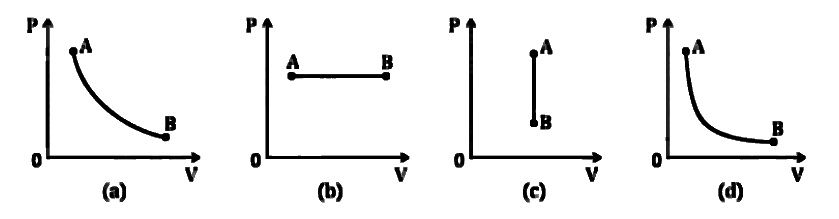
Answer: (a)
P-V Diagrams & Cyclic Processes
Which of the following graphs between pressure and volume of a gas correctly shows isochoric process in thermodynamics?
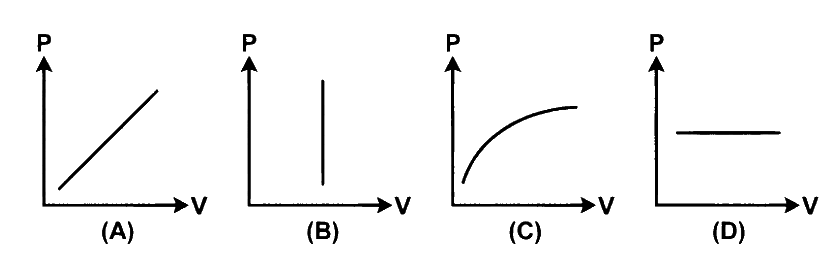
Answer: (d)
P-V Diagrams & Cyclic Processes
In a cyclic process, work done by the system is
Answer: (b)
P-V Diagrams & Cyclic Processes
In case of 'free expansion', which one of the following statements is 'WRONG'?
Answer: (c)
P-V Diagrams & Cyclic Processes
There is an expansion of a gas in a thermodynamic system. But this change cannot be plotted on a P-V diagram. Then it is
Answer: (b)
P-V Diagrams & Cyclic Processes
In thermodynamic process for free expansion, select the 'WRONG' statement out of the following options.
Answer: (b)
P-V Diagrams & Cyclic Processes
One mole of an ideal diatomic gas undergoes a transition from A to B along a path AB as shown. The change in internal energy of the gas during the transition is
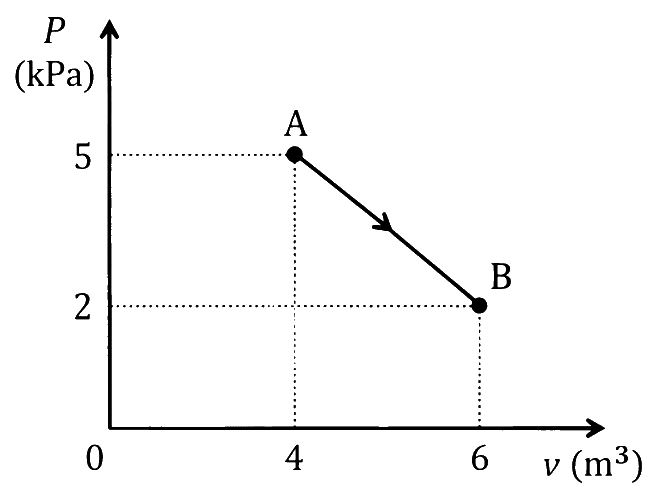
Answer: (b)
P-V Diagrams & Cyclic Processes
10 mole of an ideal gas is undergoing the process shown in the figure. The heat involved in the process from to is Joule ( and
. The value of is ______.
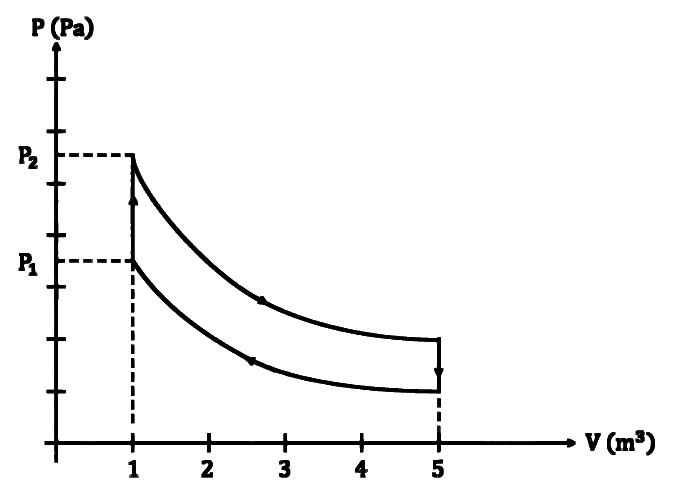
Answer: (a)
P-V Diagrams & Cyclic Processes
Consider diagram for an ideal gas as shown. Out of the following diagrams which represents the diagram?
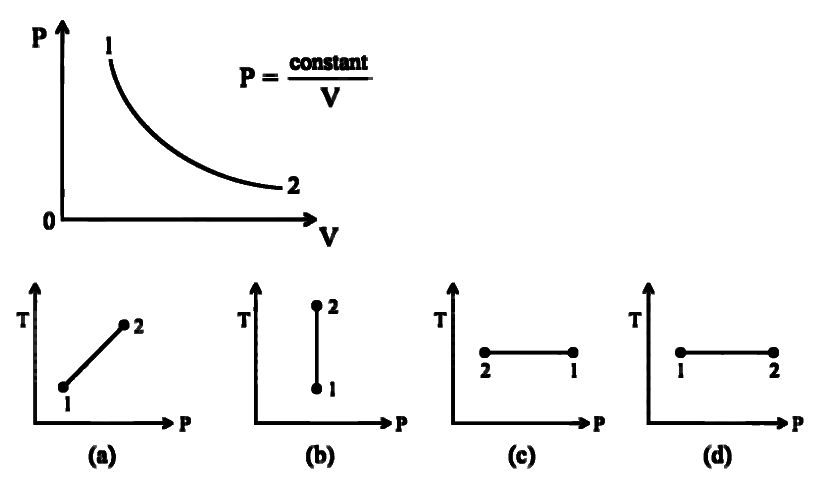
Answer: (b)
P-V Diagrams & Cyclic Processes
One mole of a mono-atomic ideal gas is taken through a cycle ABCDA as shown in the P-V diagram, then
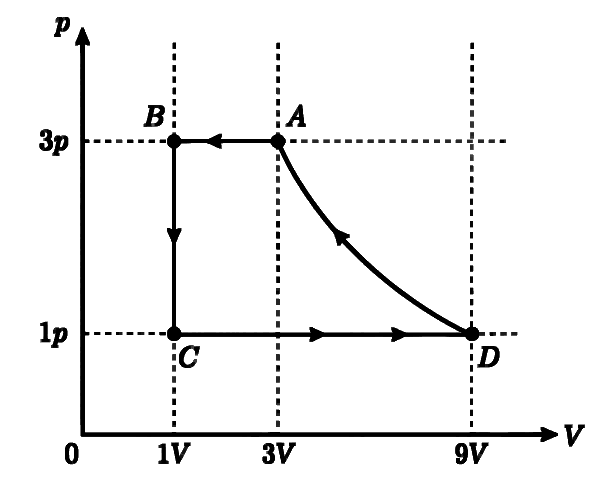
Answer: (c)
P-V Diagrams & Cyclic Processes
An ideal monoatomic gas is taken around the cycle ABCDA as shown in the P.V diagram. The work done during the cycle is
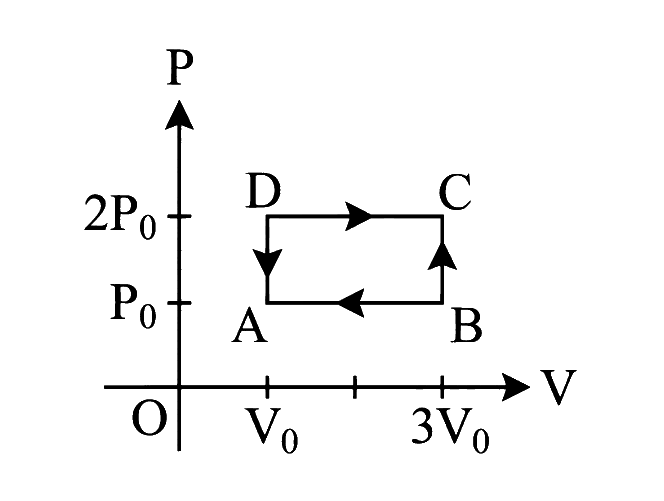
Answer: (c)
P-V Diagrams & Cyclic Processes
An ideal gas undergoes cyclic process ABCDA as shown in given p-V diagram. What is the magnitude of amount of work done by the gas?
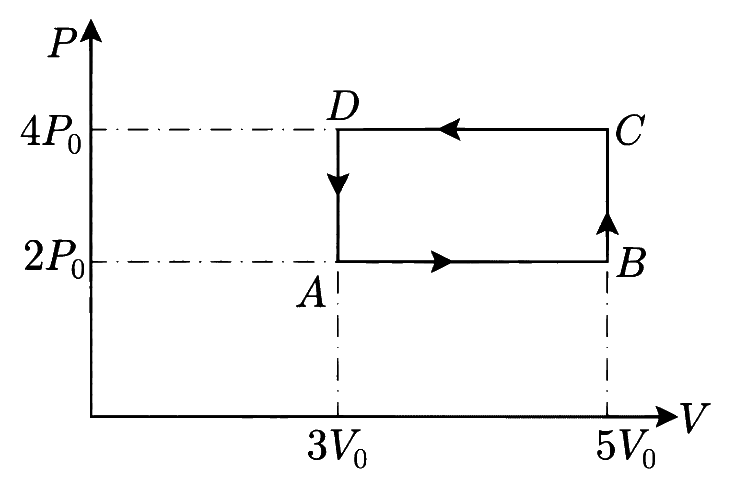
Answer: (b)
P-V Diagrams & Cyclic Processes
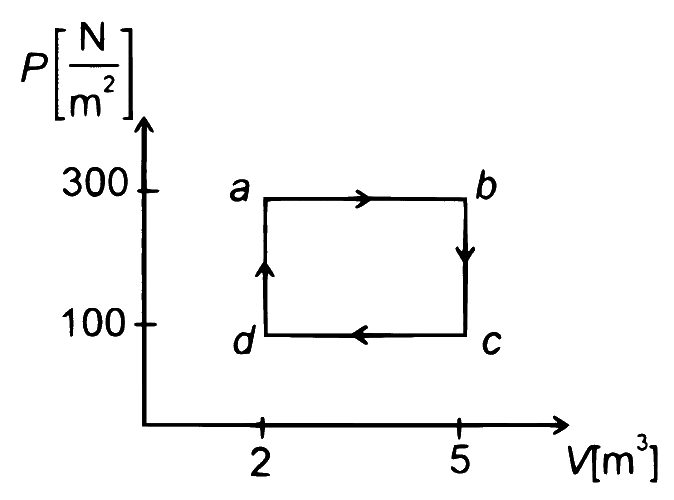
One mole of an ideal monatomic gas undergoes a cyclic process as shown in the figure. The total heat supplied to the gas is:
Answer: (d)
P-V Diagrams & Cyclic Processes
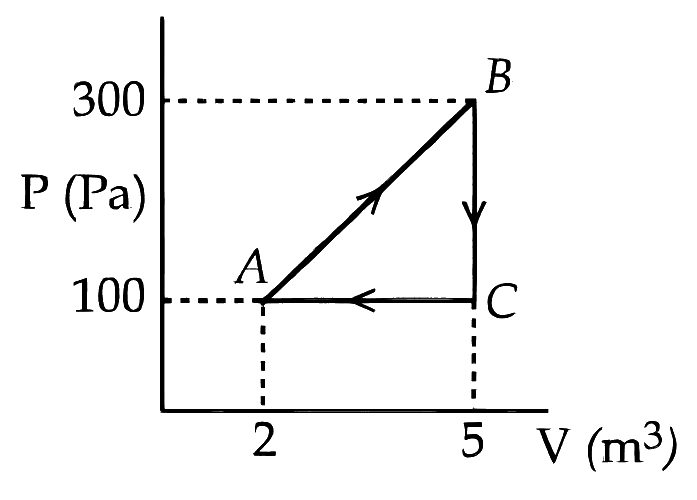
A thermodynamic system is taken through the cyclic process ABC as shown in the figure. The total work done by the system during the cycle ABC is ______ J.
Numerical answer type. Work it out, then open the answer.
Answer: 300
P-V Diagrams & Cyclic Processes
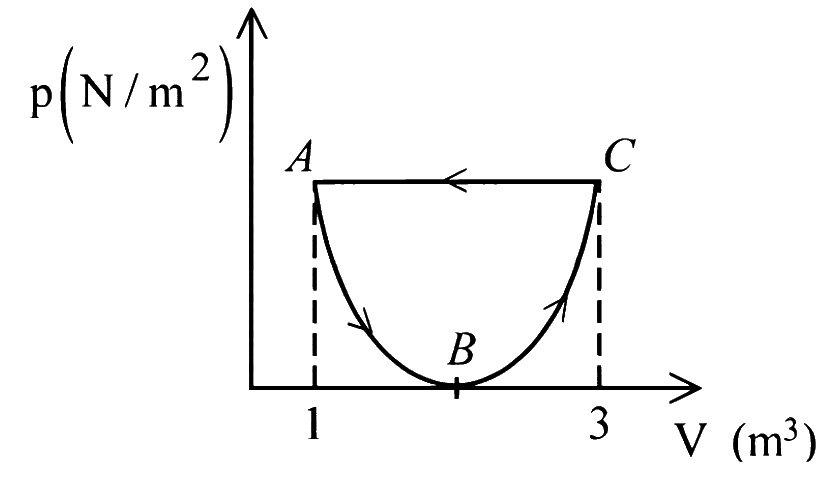
In the following diagram the equation of state along the curved path is given by where is a constant. The total work done in the closed path is
Answer: (d)
P-V Diagrams & Cyclic Processes
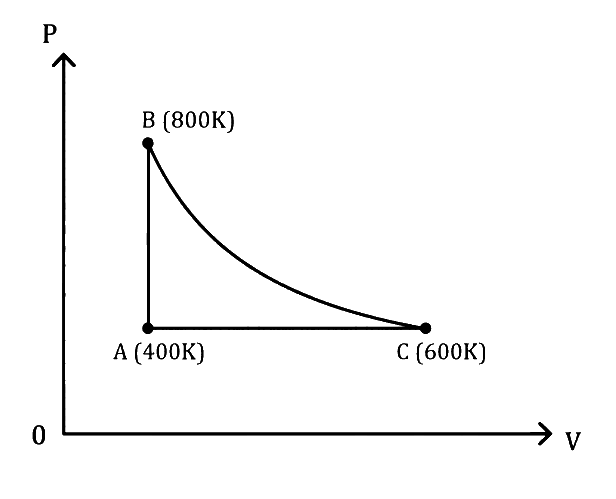
One mole of diatomic ideal gas undergoes a cyclic process ABC as shown in the figure. The process BC is adiabatic. The temperatures at A, B and C are K, K and K, respectively. The correct statement is
Answer: (d)
P-V Diagrams & Cyclic Processes
In a cyclic process, work done by the system is
Answer: (b)
P-V Diagrams & Cyclic Processes
In case of free expansion, which one of the following statements is WRONG?
Answer: (c)
P-V Diagrams & Cyclic Processes
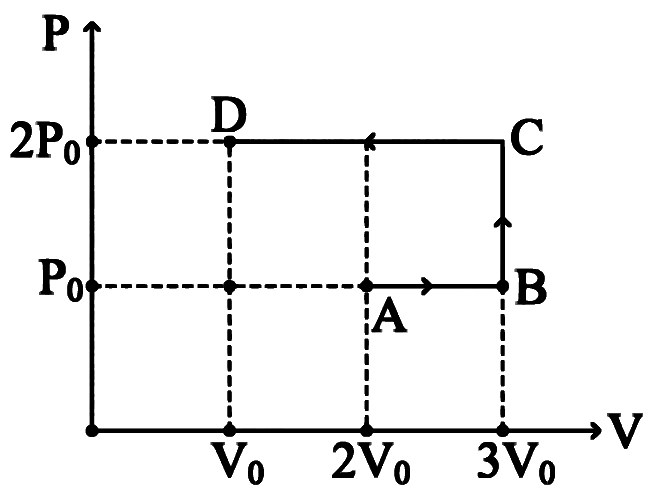
Using the given diagram, the work done by an ideal gas along the path is:
Answer: (b)
P-V Diagrams & Cyclic Processes
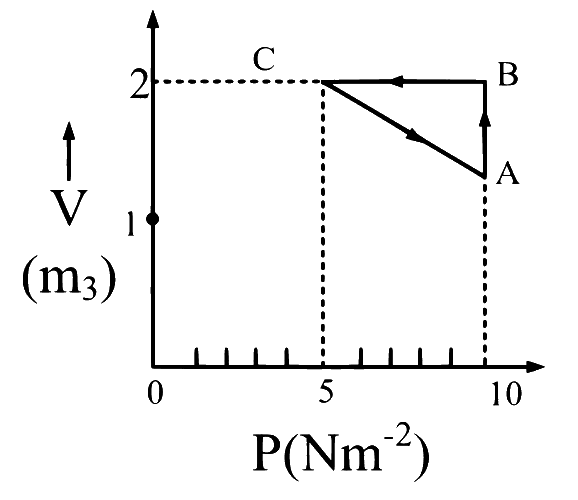
An ideal gas taken through a process ABCA as shown in figure. If the net heat supplied to gas in the cycle is 5 J, then the work done by the gas in process from C to A is
Answer: (a)
P-V Diagrams & Cyclic Processes
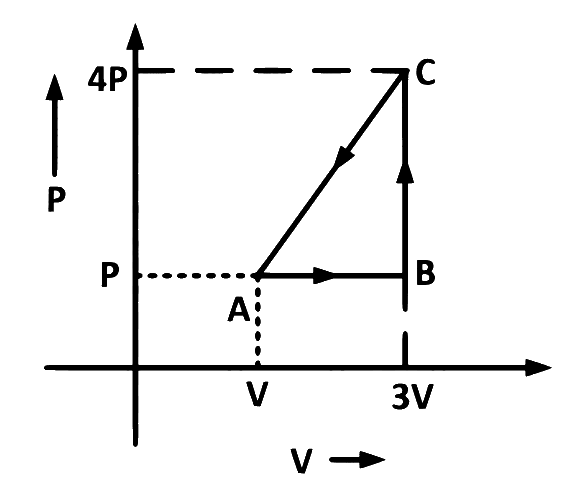
The work done by a gas as it is taken in a cyclic process (shown in graph) is
Answer: (d)
P-V Diagrams & Cyclic Processes
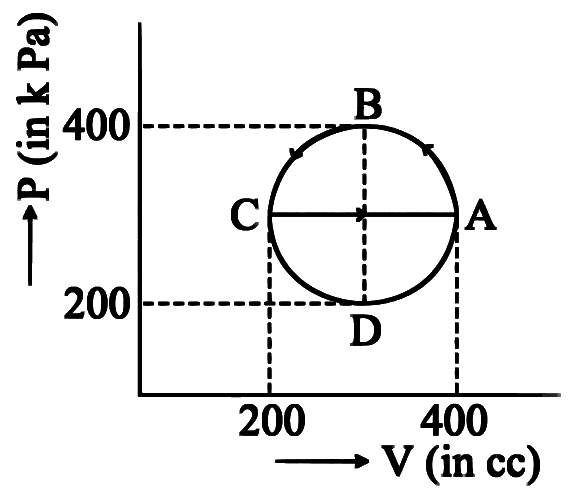
The magnitude of heat exchanged by a system for the given cyclic process ABCA (as shown in figure) is (in SI unit):
Answer: (c)
P-V Diagrams & Cyclic Processes
An ideal gas has undergone through the cyclic process as shown in the figure. Work done by the gas in the entire cycle is ________ . (Take )
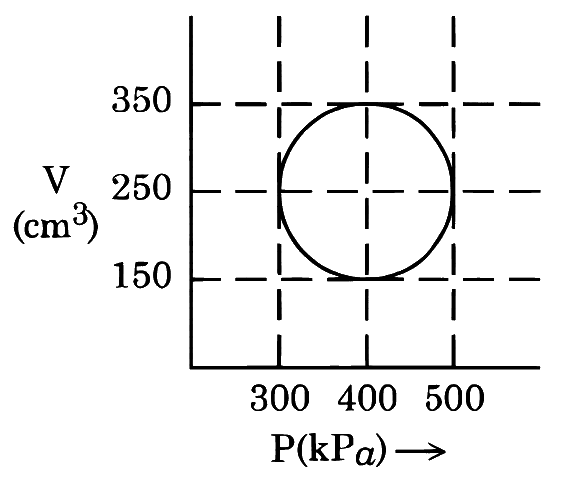
Numerical answer type. Work it out, then open the answer.
Answer: 314
P-V Diagrams & Cyclic Processes
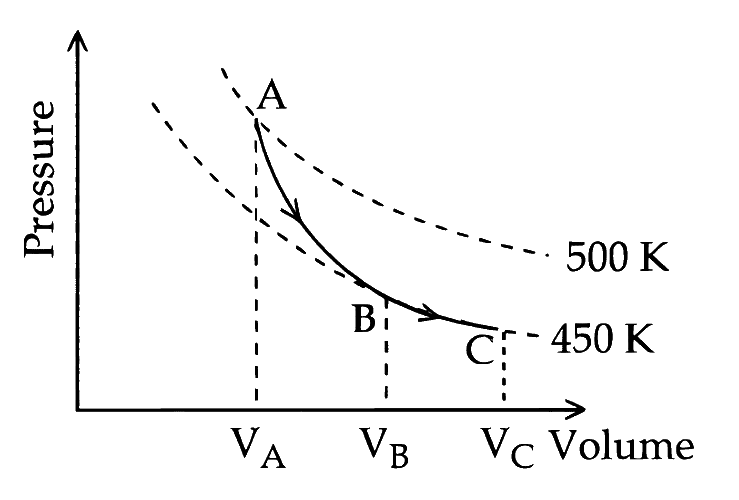
A poly-atomic molecule , where is gas constant) goes from phase space point to point to point ). A to is an adiabatic path and to is an isothermal path. The net heat absorbed per unit mole by the system is:
Answer: (b)
P-V Diagrams & Cyclic Processes
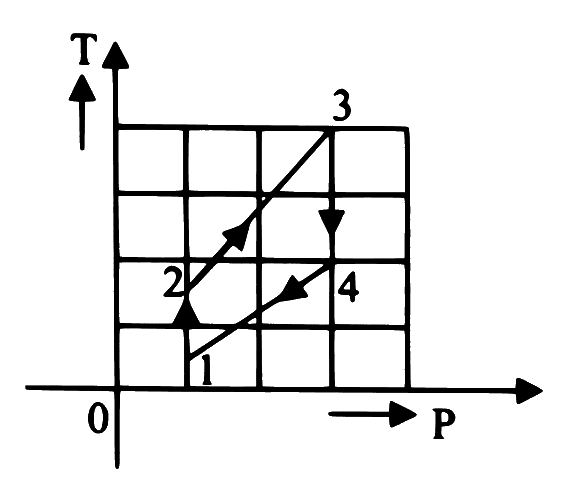
Two moles of an ideal monoatomic gas undergo a cyclic process as shown in figure. The temperatures in different states are given as . The work done by the gas during the complete cycle is ( Universal gas constant)
Answer: (a)
P-V Diagrams & Cyclic Processes
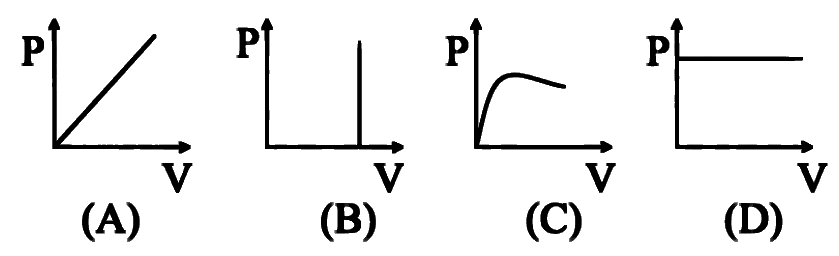
Which of the following graphs between pressure and volume correctly show isochoric process?
Answer: (d)
P-V Diagrams & Cyclic Processes
The P-V diagrams for particular gas of different thermodynamic processes are given by
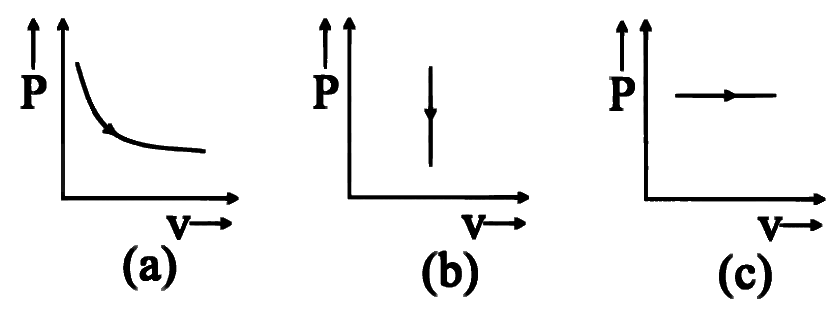
Answer: (d)
P-V Diagrams & Cyclic Processes
The P-V graph of an ideal gas, cycle is shown. The adiabatic process is described by the region
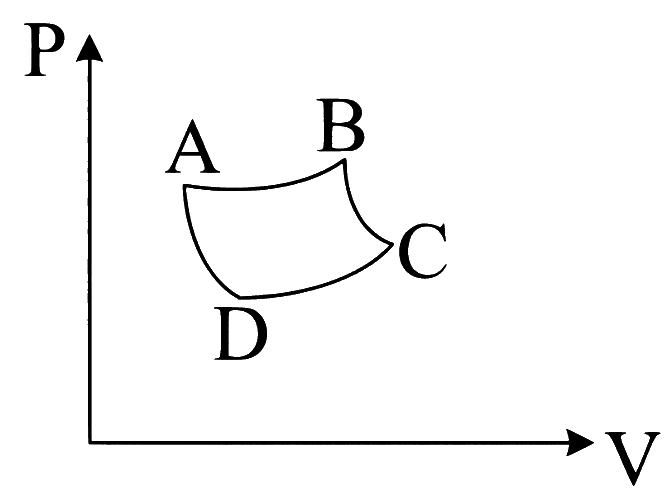
Answer: (c)
P-V Diagrams & Cyclic Processes
When a system is taken from state ' ' to state ' ' along a path abc, it is found that and . Along path adc the work done W along path adc is
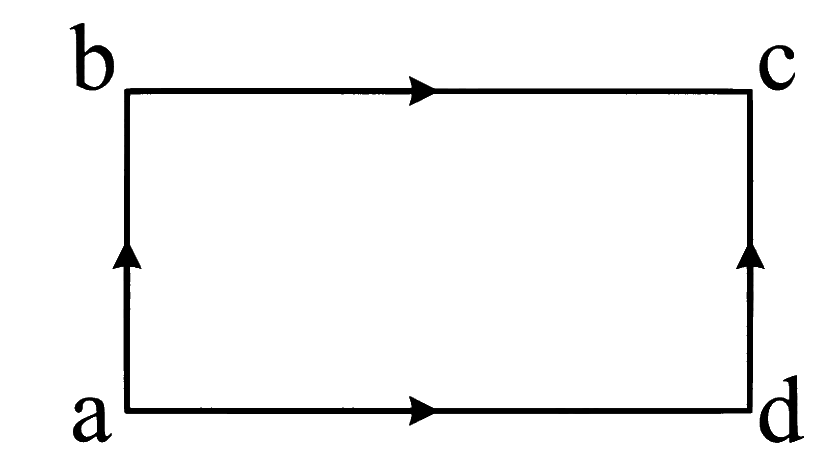
Answer: (a)
P-V Diagrams & Cyclic Processes
A thermodynamic system is taken from an original state to an intermediate state by a linear process as shown in the figure. Its volume is then reduced to the original value from to by an isobaric process. The total work done by the gas from to and to would be:
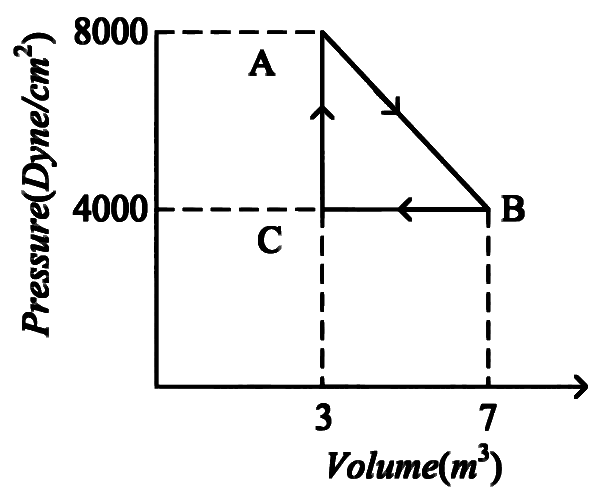
Answer: (a)
P-V Diagrams & Cyclic Processes
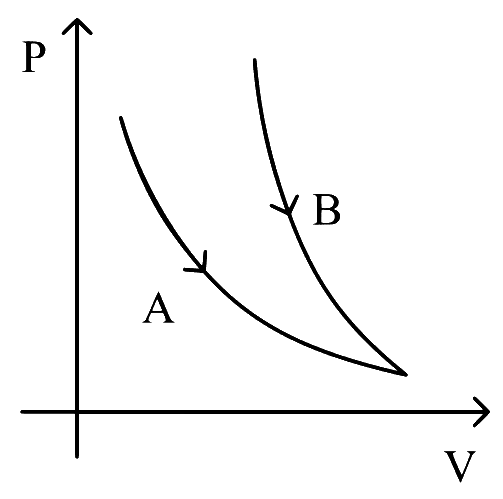
Choose the correct statement for processes A & B shown in figure.
Answer: (b)
P-V Diagrams & Cyclic Processes
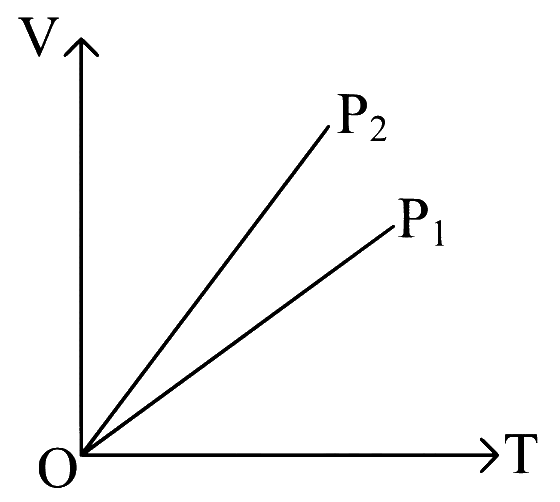
The given figure represents two isobaric processes for the same mass of an ideal gas, then
Answer: (b)
P-V Diagrams & Cyclic Processes
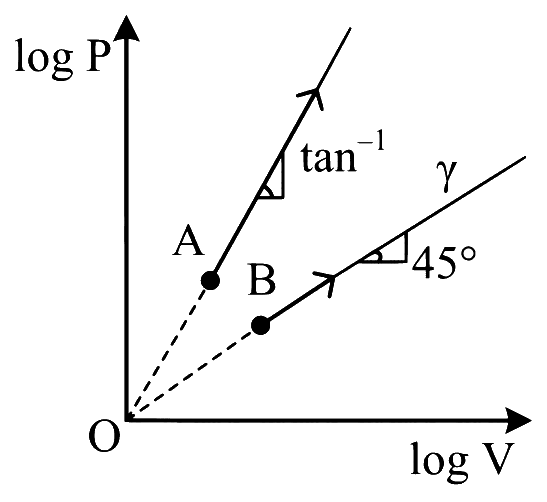
Two thermodynamical processes are shown in the figure. The molar heat capacity for process A and B are and . The molar heat capacity at constant pressure and constant volume are represented by and , respectively. Choose the correct statement.
Answer: (a)
P-V Diagrams & Cyclic Processes
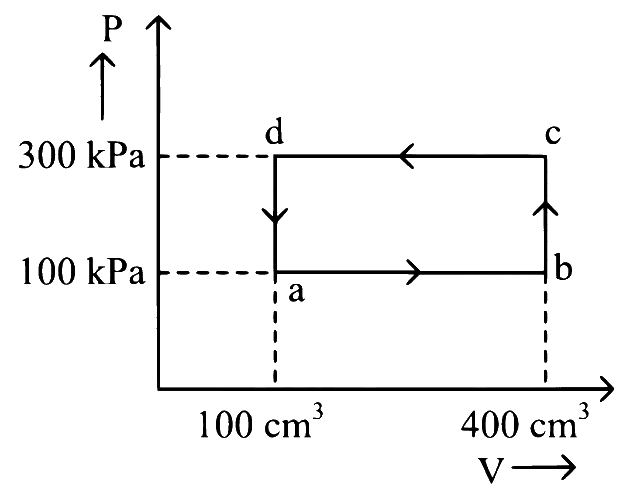
A thermodynamic system is taken through the cycle . The work done by the gas along the path is:
Answer: (a)
P-V Diagrams & Cyclic Processes
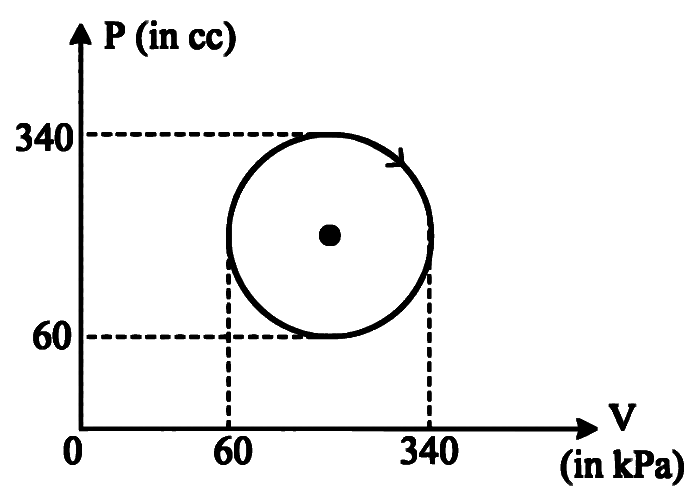
The heat absorbed by a system in going through the given cyclic process is:
Answer: (a)
P-V Diagrams & Cyclic Processes
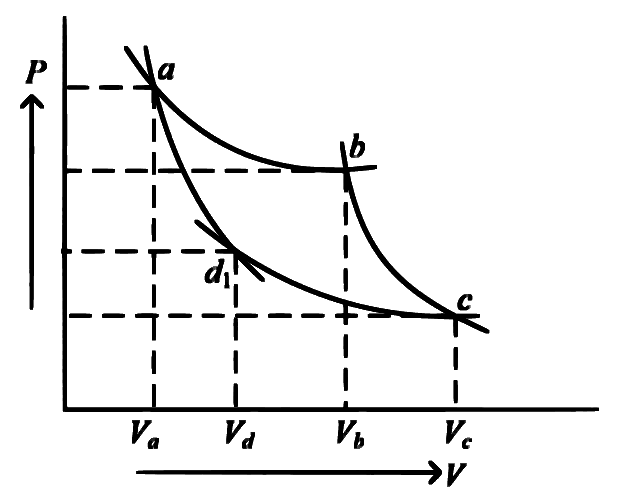
Two different adiabatic paths for the same gas intersect two isothermal curves as shown in P-V diagram. The relation between the ratio and the ratio is:
Answer: (c)
P-V Diagrams & Cyclic Processes
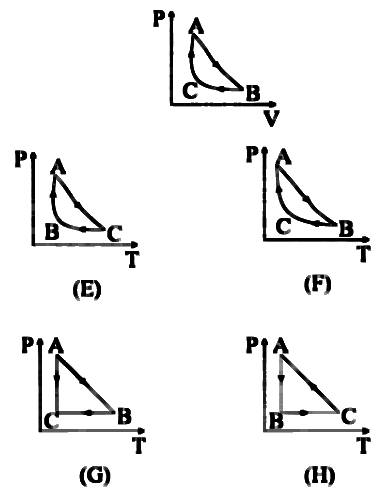
The diagram for a fixed mass of an ideal gas undergoing cyclic process is as shown in figure. AB represents isothermal process and CA represents adiabatic process. Which one of the following graphs represents the p-T diagram of this cyclic process?
Answer: (d)
P-V Diagrams & Cyclic Processes
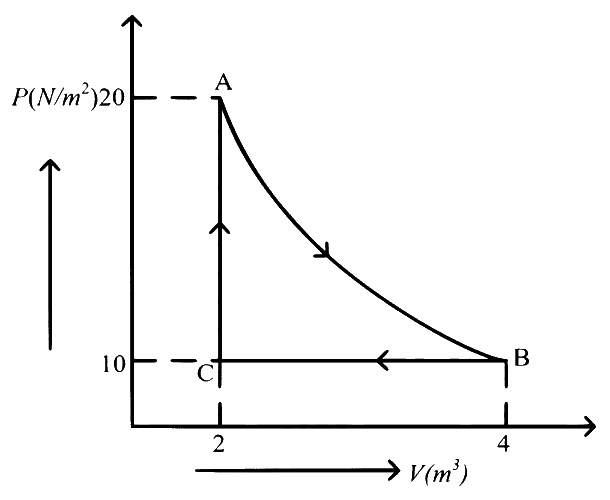
A real gas within a closed chamber at undergoes the cyclic process as shown in figure. The gas obeys equation for the path to . The net work done in the complete cycle is (assuming ):
Answer: (b)
P-V Diagrams & Cyclic Processes
Which of the following graphs between pressure (P) and volume (V) correctly shows isochoric changes?
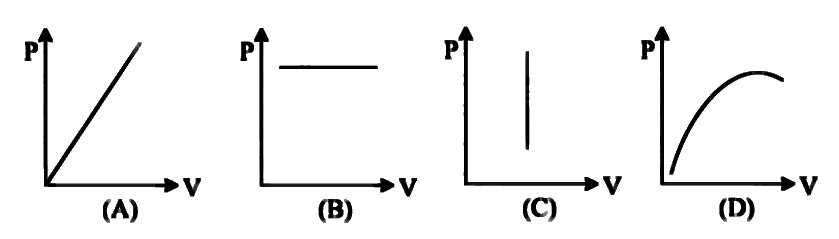
Answer: (c)
P-V Diagrams & Cyclic Processes
For the given cycle, the work done during isobaric process is:
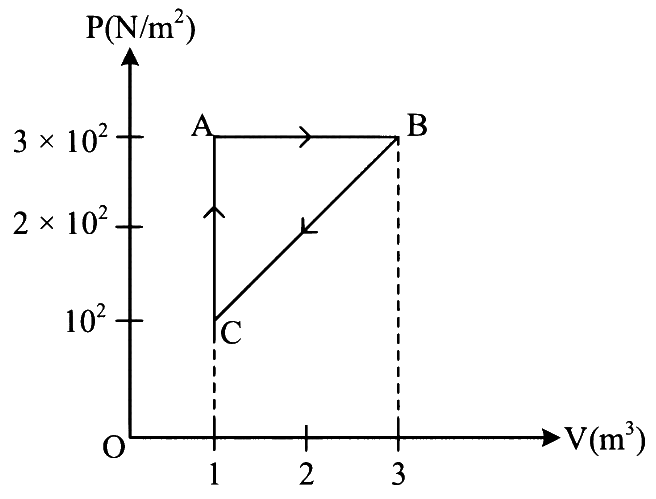
Answer: (d)
P-V Diagrams & Cyclic Processes
A thermodynamic system is taken through cyclic process. The total work done in the process is:
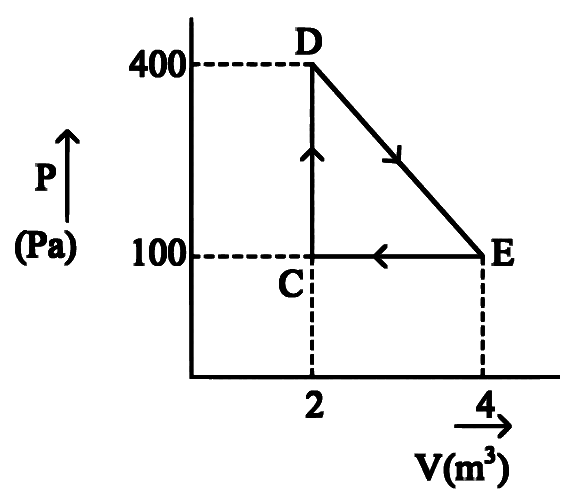
Answer: (c)
P-V Diagrams & Cyclic Processes
The pressure of a gas changes linearly with volume from to as shown in figure. If no heat is supplied to or extracted from the gas then change in the internal energy of the gas will be
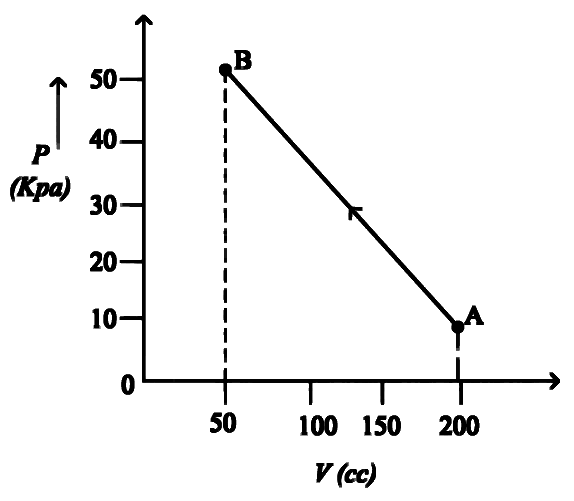
Answer: (b)
P-V Diagrams & Cyclic Processes
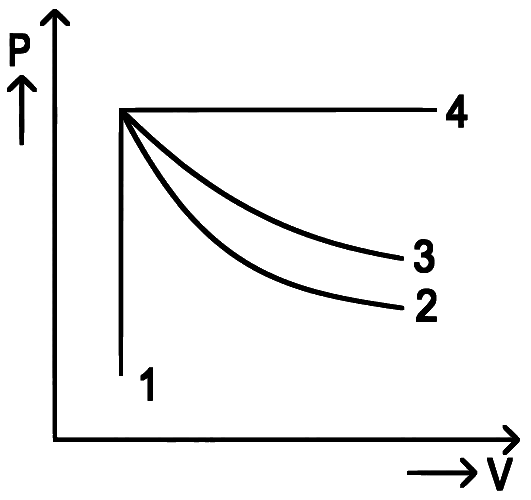
An ideal gas undergoes four different processes from the same initial state as shown in the figure below. Those processes are adiabatic, isothermal, isobaric and isochoric. The curve which represents the adiabatic process among 1, 2, 3 and 4 is
Answer: (b)
P-V Diagrams & Cyclic Processes
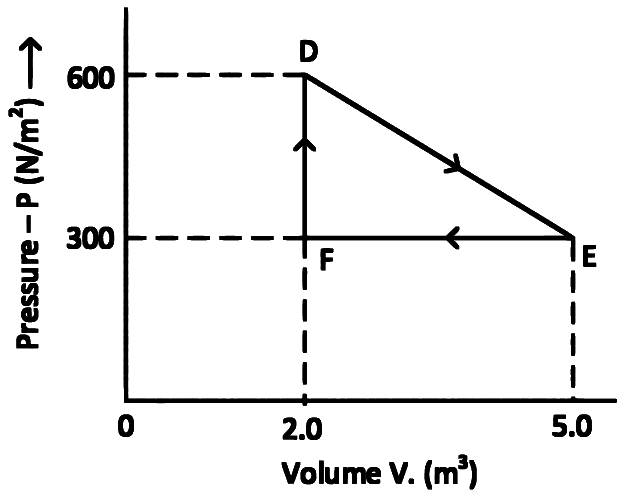
A thermodynamic system is taken from an original state D to an intermediate state E by the linear process shown in the figure. Its volume is then reduced to the original volume from E to F by an isobaric process. The total work done by the gas from D to E to F will be
Answer: (b)
P-V Diagrams & Cyclic Processes
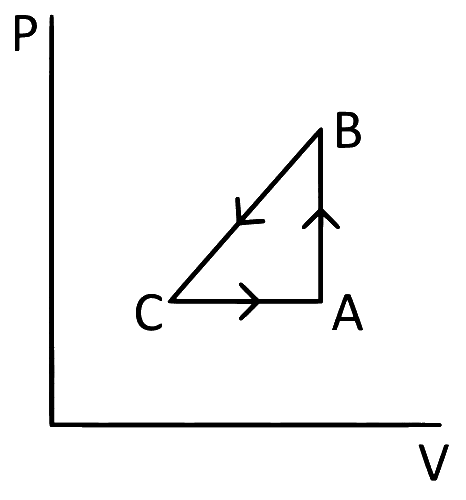
A sample of an ideal gas is taken through the cyclic process ABCA as shown in figure. It absorbs, 40 J of heat during the part AB, no heat during BC and rejects 60 J of heat during CA. A work of 50 J is done on the gas during the part BC. The internal energy of the gas at A is 1560 J. The workdone by the gas during the part CA is:
Answer: (b)
P-V Diagrams & Cyclic Processes
In thermodynamics, heat and work are:
Answer: (a)
P-V Diagrams & Cyclic Processes
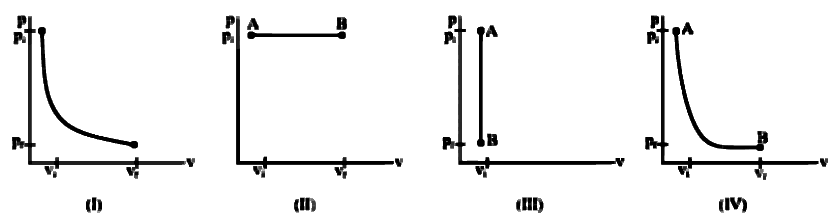
Which one of the following p-V diagram is correct for an isochoric process:
Answer: (c)
P-V Diagrams & Cyclic Processes
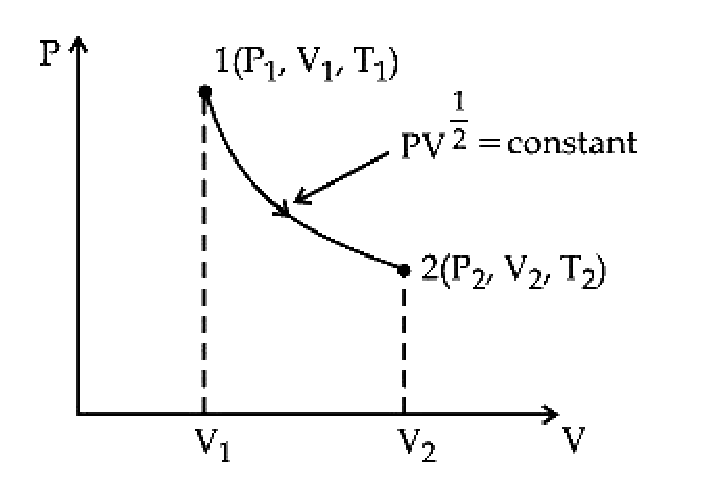
Thermodynamic process is shown below on a P-V diagram for one mole of an ideal gas. If V2 = 2V1 then the ratio of temperature T2/T1 is:
Answer: (a)
P-V Diagrams & Cyclic Processes
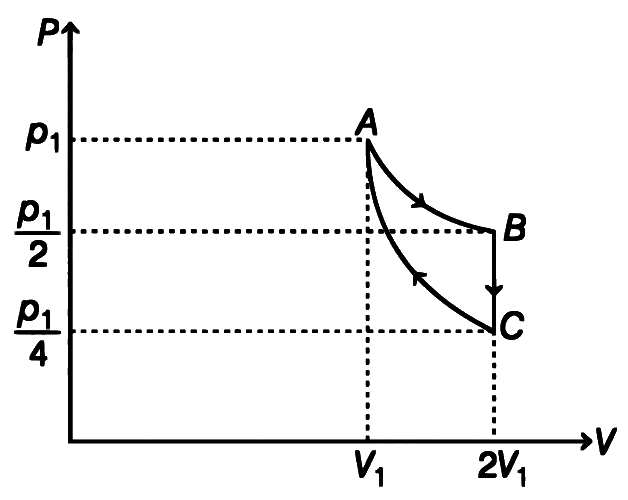
If one mole of an ideal gas at (P1, V1) is allowed to expand reversibly and isothermally (A to B) its pressure is reduced to one-half of the original pressure (see figure). This is followed by a constant volume cooling till its pressure is reduced to one-fourth of the initial value (B C). Then it is restored to its initial state by a reversible adiabatic compression (C to A). The net work done by the gas is equal to:
Answer: (b)
P-V Diagrams & Cyclic Processes
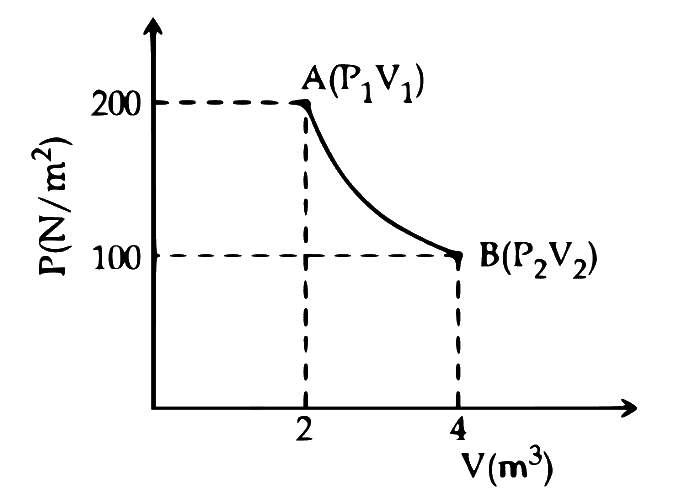
One mole of an ideal gas at 27C is taken from A to B as shown in the given PV indicator diagram. The work done by the system will be _________ 101 J. [Given: R = 8.3 J/mole K, ln2 = 0.6931] (Round off to the nearest integer)
Numerical answer type. Work it out, then open the answer.
Answer: 17258
P-V Diagrams & Cyclic Processes
In the reported figure, there is a cyclic process ABCDA on a sample of 1 mol of a diatomic gas. The temperature of the gas during the process A B and C D are T1 and T2 (T1 > T2) respectively.
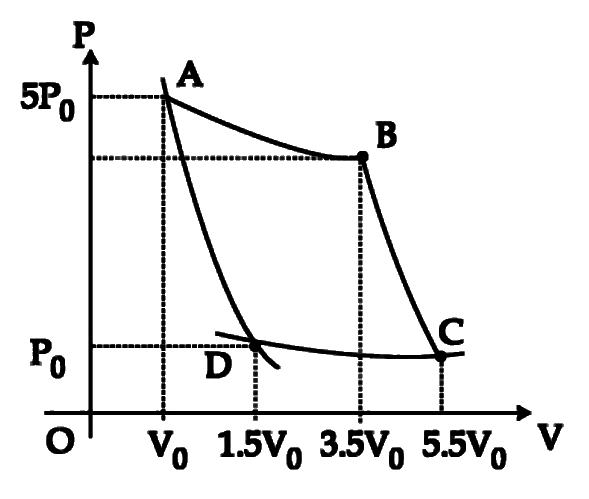
Choose the correct option out of the following for work done if processes BC and DA are adiabatic.
Answer: (b)
P-V Diagrams & Cyclic Processes
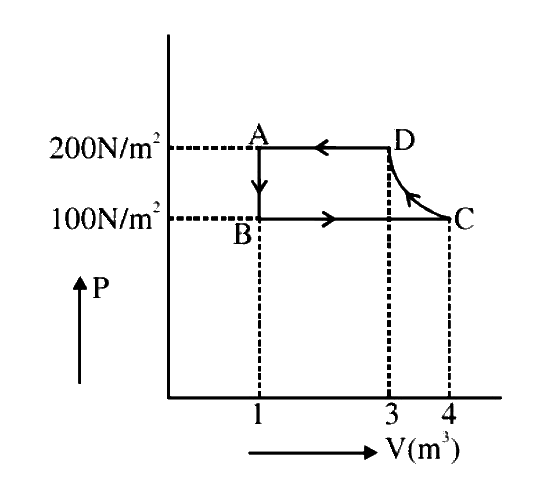
The P-V diagram of a diatomic ideal gas system going under cyclic process as shown in figure. The work done during an adiabatic process CD is (use = 1.4):
Answer: (a)
P-V Diagrams & Cyclic Processes
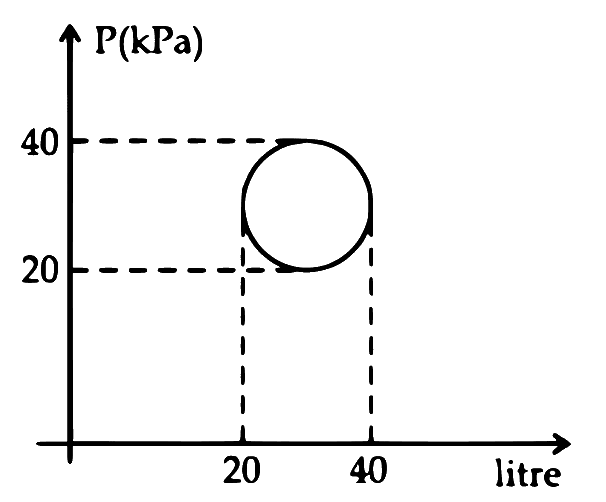
In the reported figure, heat energy absorbed by a system in going through a cyclic process is ___________ J.
Numerical answer type. Work it out, then open the answer.
Answer: 100
P-V Diagrams & Cyclic Processes
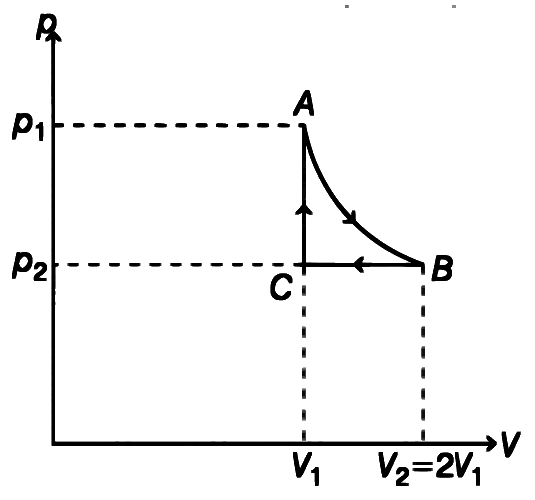
n mole of a perfect gas undergoes a cyclic process ABCA (see figure) consisting of the following processes.
A B: Isothermal expansion at temperature T so that the volume is doubled from V1 to V2 = 2V1 and pressure changes from P1 to P2
B C: Isobaric compression at pressure P2 to initial volume V1.
C A: Isochoric change leading to change of pressure from P2 to P1.
Total work done in the complete cycle ABCA is:
Answer: (c)
P-V Diagrams & Cyclic Processes
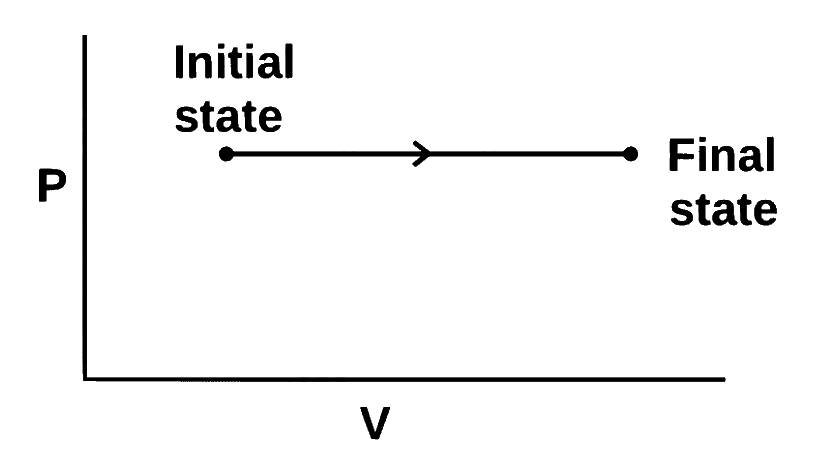
The diagram for an ideal gas in a piston cylinder assembly undergoing a thermodynamic process is shown in the figure. The process is
Answer: (d)
P-V Diagrams & Cyclic Processes
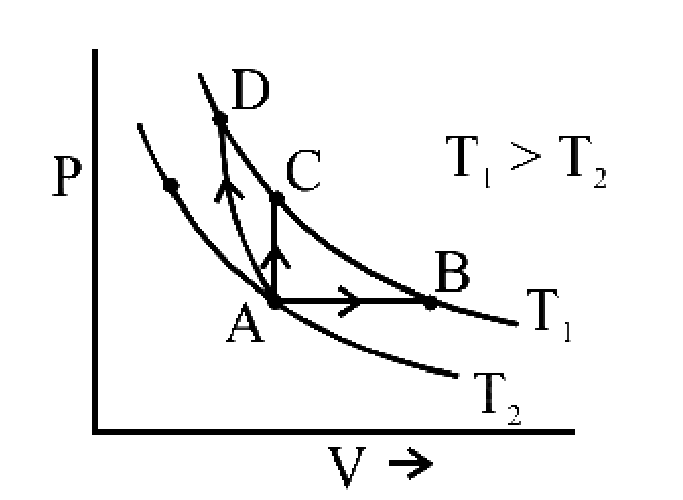
Three different processes that can occur in an ideal monoatomic gas are shown in the P vs V diagram. The paths are labelled as A B, A C and A D. The change in internal energies during these process are taken as EAB, EAC and EAD and the work done as WAB, WAC and WAD. The correct relation between these parameters are:
Answer: (b)
P-V Diagrams & Cyclic Processes
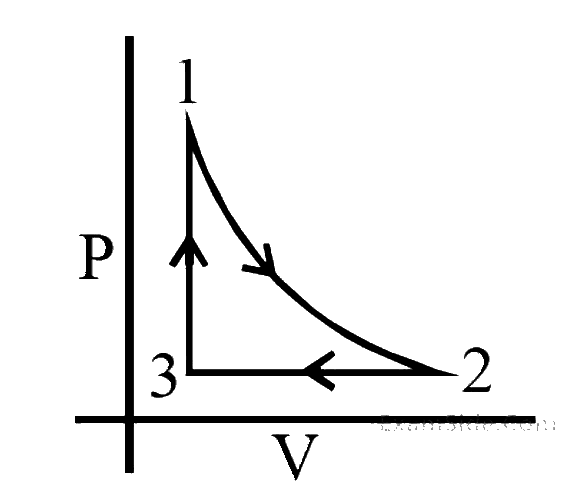
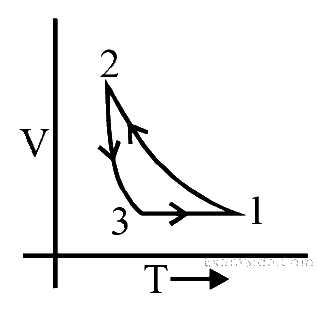
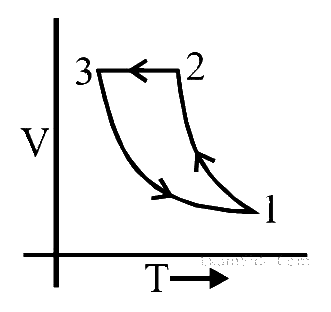
Which of the following is an equivalent cyclic process corresponding to the thermodynamic cycle given in the figure? where, 1 2 is adiabatic.
(Graphs are schematic and are not to scale)
(A)
(B)
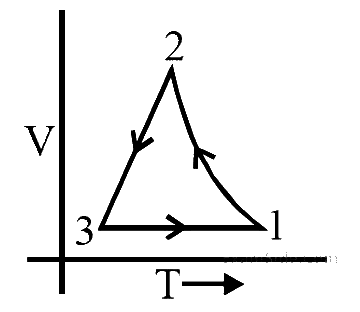
(C)
Numerical answer type. Work it out, then open the answer.
Answer: b
P-V Diagrams & Cyclic Processes
A thermodynamic cycle xyzx is shown on a V-T diagram.
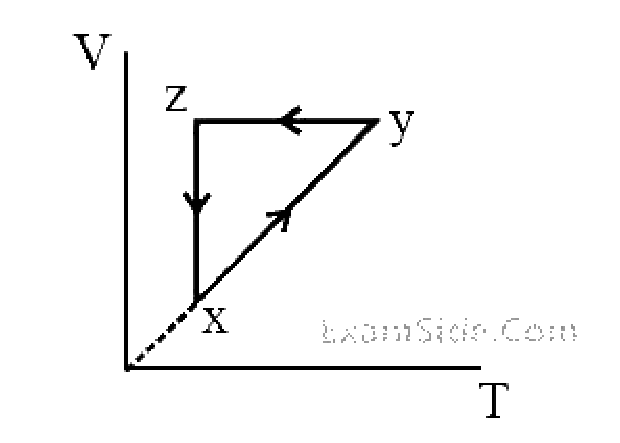
The P-V diagram that best describes this cycle is:
(Diagrams are schematic and not to scale)
Answer: (a)
P-V Diagrams & Cyclic Processes
Following figure shows two processes A and B for a gas. If QA and QB are the amount of heat absorbed by the system in two cases, and UA and UB are changes in internal energies, respectively, then:
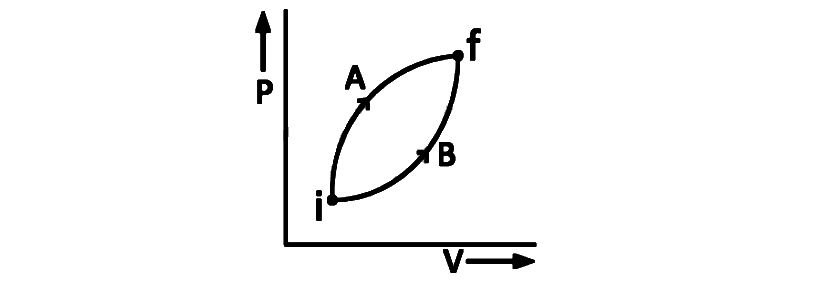
Answer: (c)
P-V Diagrams & Cyclic Processes
A gas can be taken from A to B via two different processes ACB and ADB.
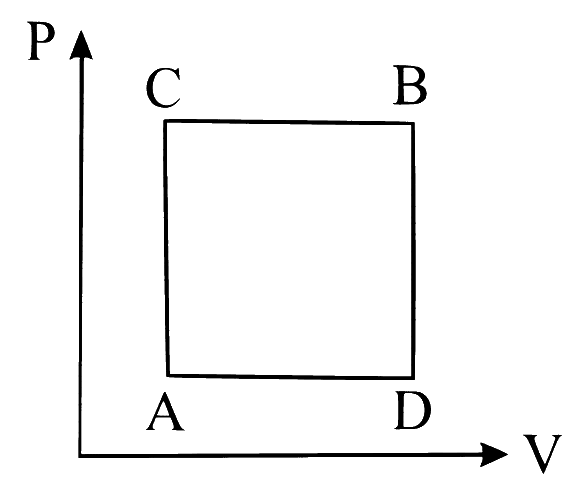
When path ACB is used 60 J of heat flows into the system and 30 J of work is done by the system. If path ADB is used work done by the system is 10 J. The heat Flow into the system in path ADB is:
Answer: (a)
P-V Diagrams & Cyclic Processes
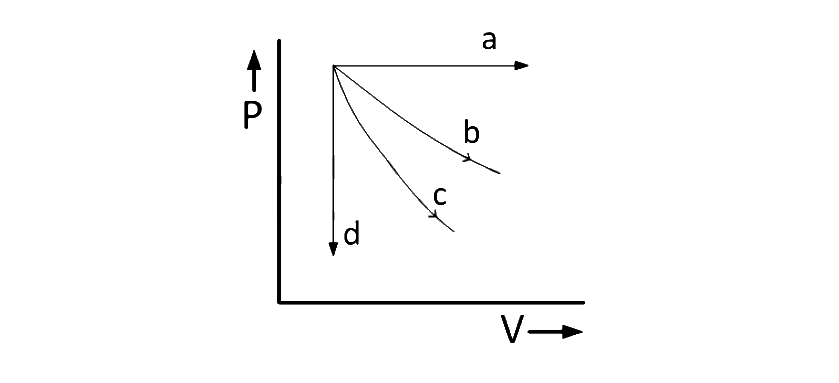
The given diagram shows four processes i.e., isochoric, isobaric, isothermal and adiabatic. The correct assignment of the processes, in the same order is given by :-
Answer: (a)
P-V Diagrams & Cyclic Processes
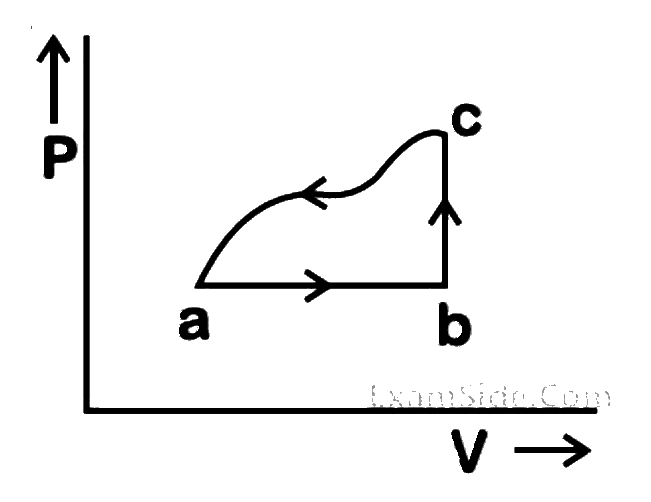
A sample of an ideal gas is taken through the cyclic process abca as shown in the figure. The change in the internal energy of the gas along the path ca is –180 J. The gas absorbs 250 J of heat along the path ab and 60 J along the path bc. The work done by the gas along the path abc is:
Answer: (b)
P-V Diagrams & Cyclic Processes
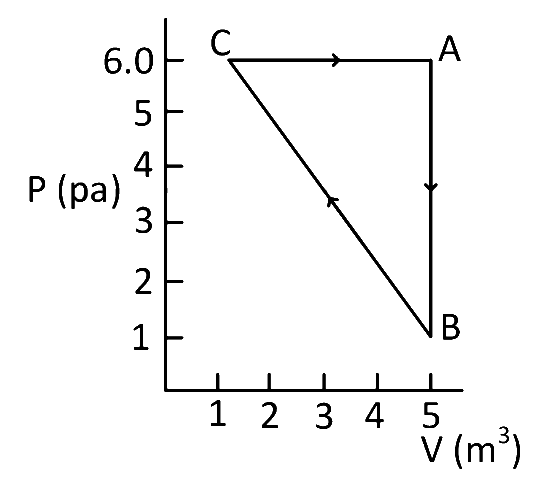
For the given cyclic process CAB as shown for a gas, the work done is:
Answer: (b)
P-V Diagrams & Cyclic Processes
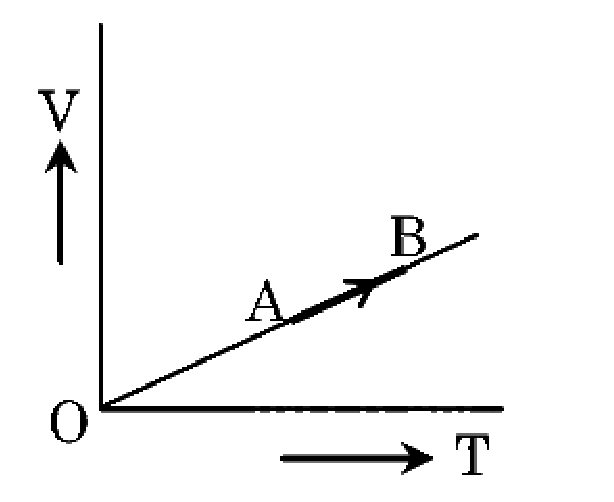
The volume (V) of a monatomic gas varies with its temperature (T), as shown in the graph. The ratio of work done by the gas, to the heat absorbed by it, when it undergoes a change from state A to state B, is
Answer: (a)
P-V Diagrams & Cyclic Processes
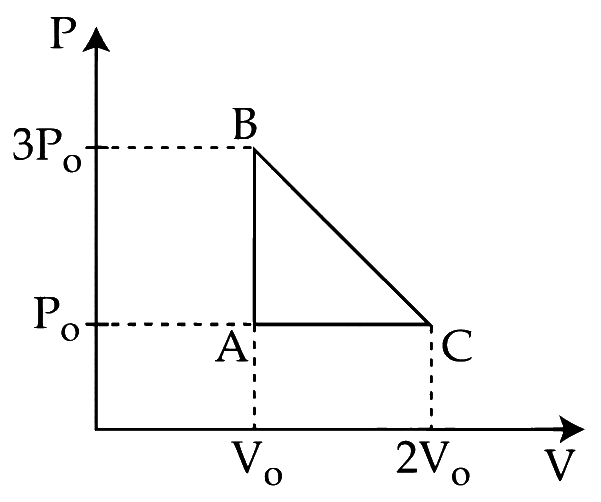
One mole of an ideal monoatomic gas is taken along the path ABCA as shown in the PV diagram. The maximum temperature attained by the gas along the path BC is given by:
Answer: (b)
P-V Diagrams & Cyclic Processes
Thermodynamic processes are indicated in the following diagram.
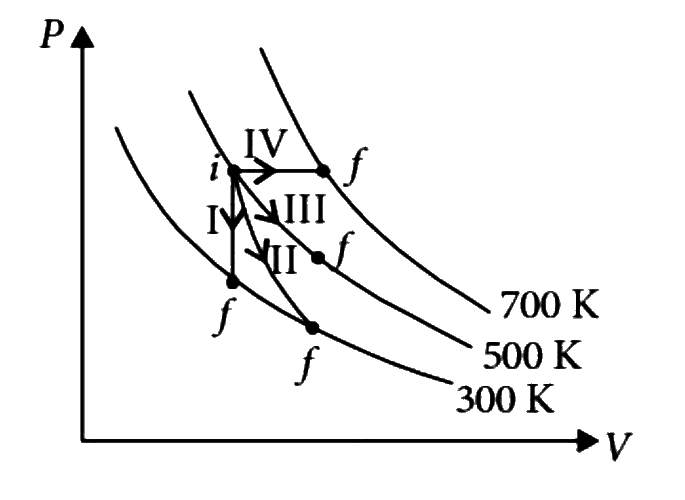
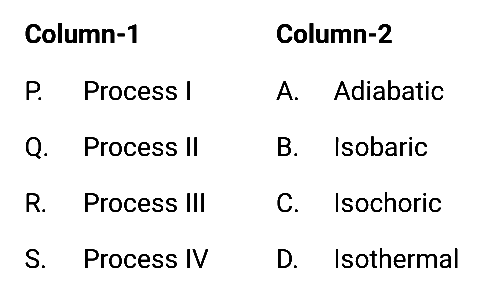
Match the following
Answer: (a)
P-V Diagrams & Cyclic Processes
For the P-V diagram given for an ideal gas,
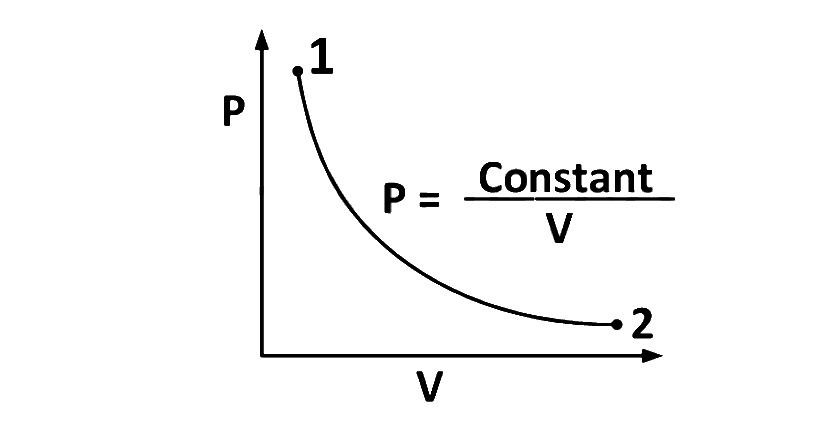
out of the following which one correctly represents the T-P diagram?
(A)
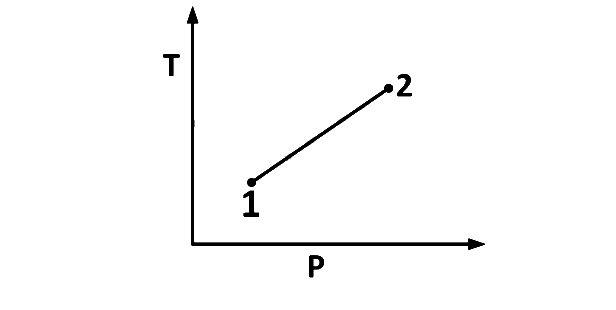
(B)
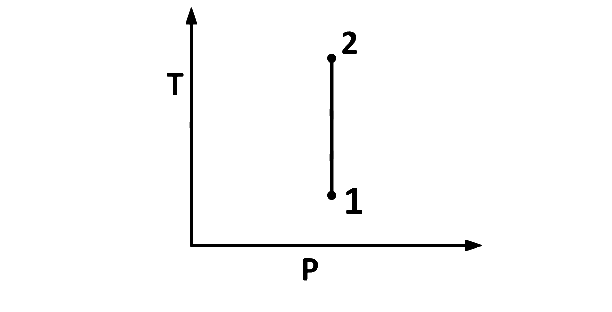
(C)
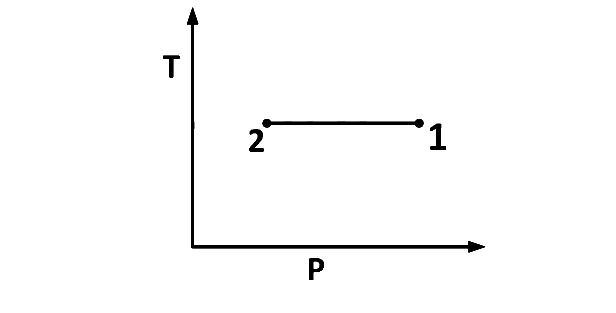
Numerical answer type. Work it out, then open the answer.
Answer: c
P-V Diagrams & Cyclic Processes
moles of an ideal gas undergoes a process as shown in the figure. The maximum temperature of the gas during the process will be:
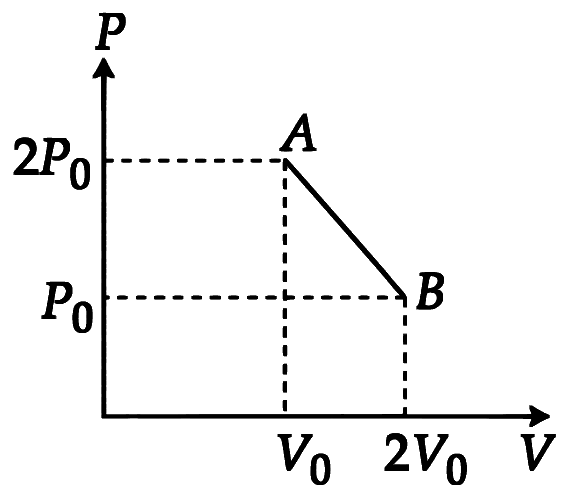
Answer: (c)
P-V Diagrams & Cyclic Processes
One mole of an ideal diatomic gas undergoes a transition from A to B along a path AB as shown in the figure.
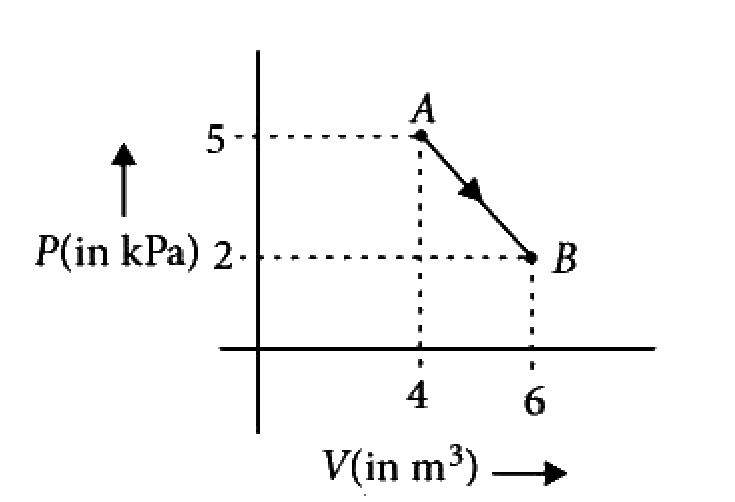
The change in internal energy of the gas during the transition is
Answer: (d)
P-V Diagrams & Cyclic Processes
Figure below shows two paths that may be taken by a gas to go from a state A to a state C.
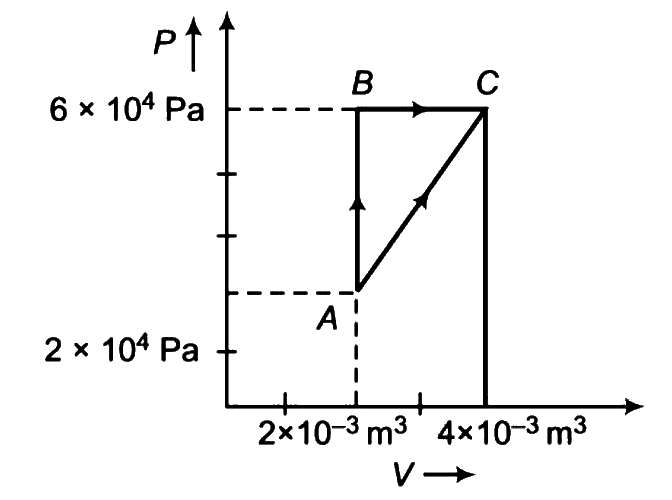
In process AB, 400 J of heat is added to the system and in process BC, 100 J of heat is added to the system. The heat absorbed by the system in the process AC will be
Answer: (a)
P-V Diagrams & Cyclic Processes
An ideal gas goes through a reversible cycle a b c d which has the V T diagram shown below. Process d a and b c are adiabatic.
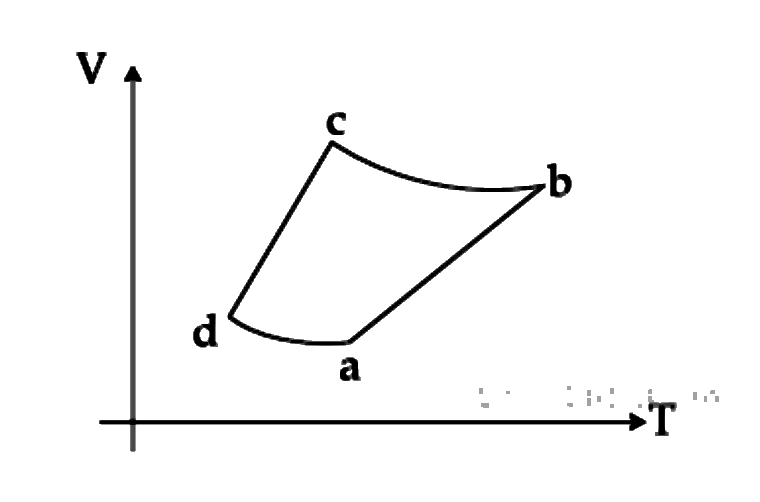
The corresponding P - V diagram for the process is (all figures are schematic and not drawn to scale):
(A)
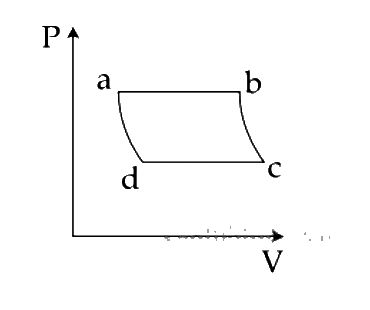
(B)
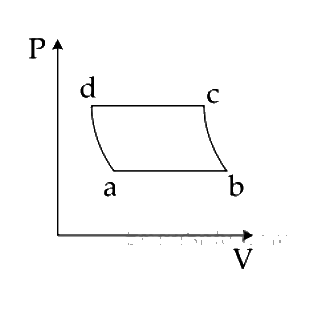
(C)
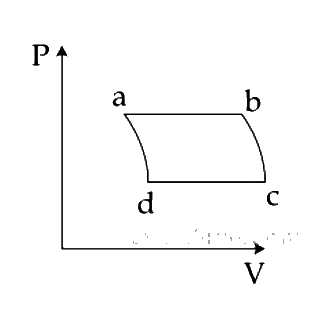
Numerical answer type. Work it out, then open the answer.
Answer: a
P-V Diagrams & Cyclic Processes
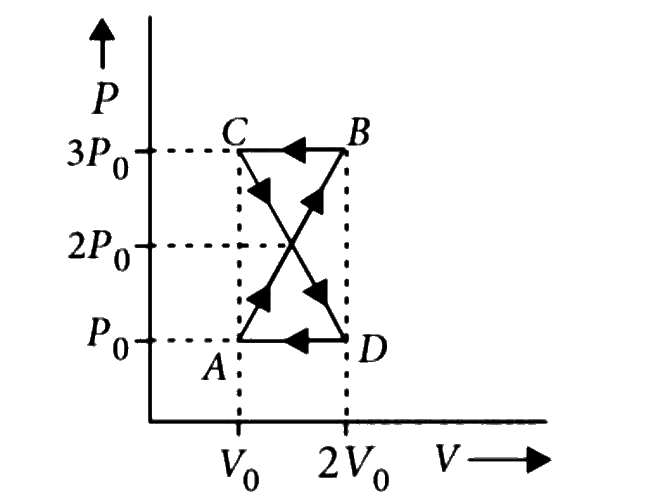
A thermodynamic system undergoes cyclic process ABCDA as shown in figure. The work done by the system in the cycle is
Answer: (d)
P-V Diagrams & Cyclic Processes
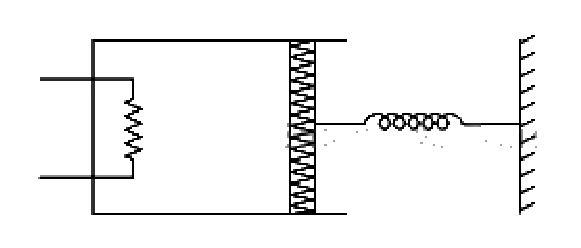
An ideal monoatomic gas is confined in a cylinder by a spring loaded piston of cross section 8.0 10 3 m2. Initially the gas is at 300K and occupies a volume of 2.4 103 m3 and the spring is in its relaxed state as shown in figure. The gas is heated by a small heater until the piston moves out slowly by 0.1 m. The force constant of the spring is 8000 N/m and the atmospheric pressure is 1.0 105 N/m2. The cylinder and the piston are thermally insulated. The piston and the spring are massless and there is no friction between the piston and the cylinder. The final temperature of the gas will be:
(Neglect the heat loss through the lead wires of the heater. The heat capacity of the heater coil is also negligible)
Answer: (b)
P-V Diagrams & Cyclic Processes
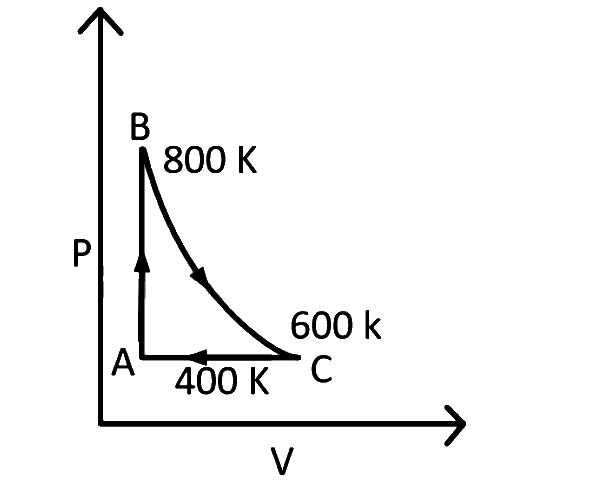
One mole of a diatomic ideal gas undergoes a cyclic process as shown in figure. The process is adiabatic. The temperatures at and are and respectively. Choose the correct statement:
Answer: (d)
P-V Diagrams & Cyclic Processes
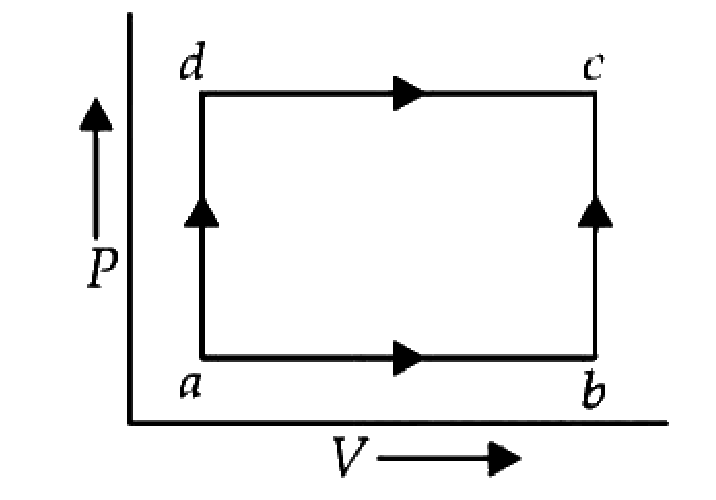
A system is taken from state a to state c by two paths adc and abc as shown in the figure. The internal energy at a is . Along the path adc the amount of heat absorbed dQ1 50 J and the work obtained dW1 20 J whereas along the path abc the heat absorbed dQ2 = 36 J. The amount of work along the path abc is
Answer: (d)
P-V Diagrams & Cyclic Processes
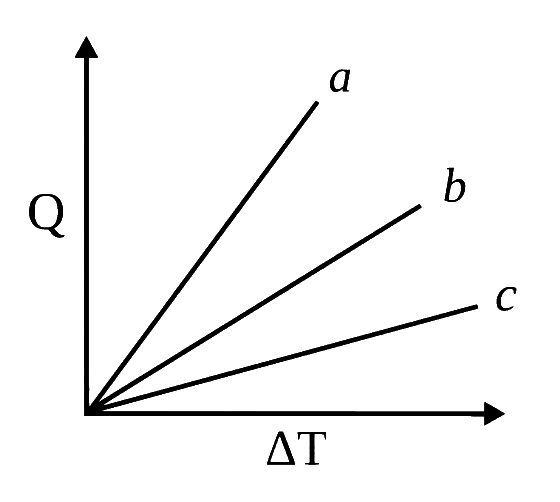
Figure shows the variation in temperature () with the amount of heat supplied (Q) in an isobaric process corresponding to a monoatomic (M), diatomic (D) and a polyatomic (P) gas. The initial state of all the gases are the same and the scales for the two axes coincide. Ignoring vibrational degrees of freedom, the lines a, b and c respectively correspond to:
Answer: (c)
P-V Diagrams & Cyclic Processes
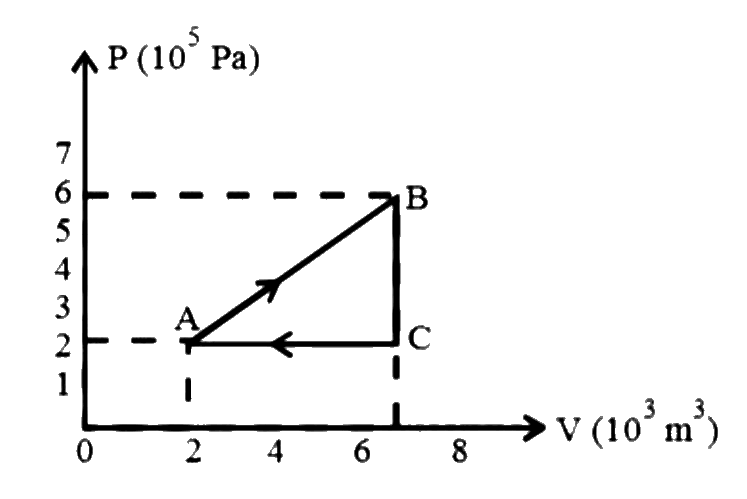
A gas is taken through the cycle
A B C A, as shown. What is the net work done by the gas?
Answer: (d)
P-V Diagrams & Cyclic Processes
A certain amount of gas is taken through a cyclic process (A B C D A) that has two isobars, one isochore and one isothermal. The cycle can be represented on a P - V indicator diagram as:
Answer: (c)
P-V Diagrams & Cyclic Processes
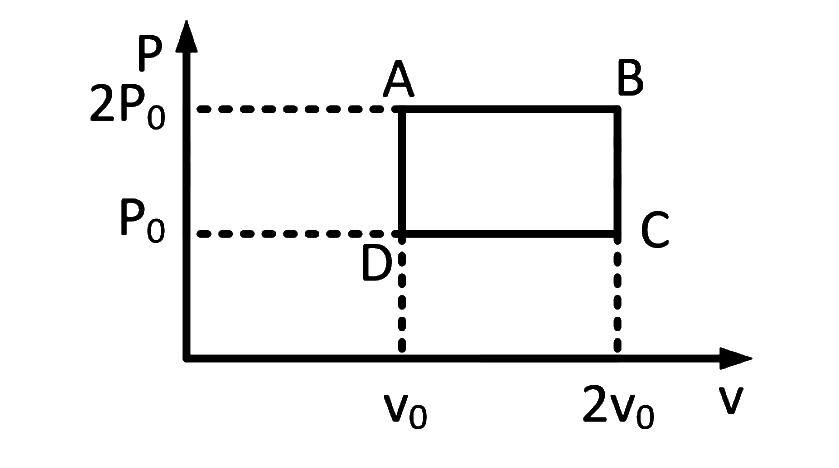
The above diagram represents the thermodynamic cycle of an engine, operating with an ideal monatomic gas. The amount of heat, extracted from the source in a single cycle is
Answer: (b)
P-V Diagrams & Cyclic Processes
An ideal gas goes from state A to state B via three different processes as indicated in the P-V diagram.
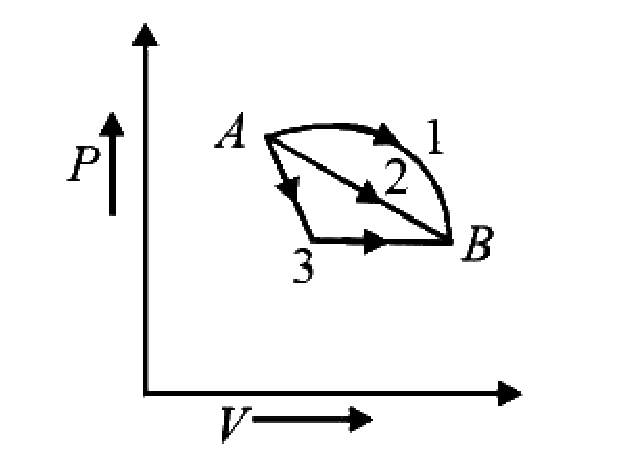
If Q1, Q2, Q3 indicate the heat absorbed by the gas along the three processes and U1, U2, U3 indicate the change in internal energy along the three processes respectively, then
Answer: (a)
P-V Diagrams & Cyclic Processes
One mole of an ideal gas goes from an initial state A to final state B via two processes: It first undergoes isothermal expansion from volume V to 3V and then its volume is reduced from 3V to V at constant pressure. The correct P-V diagram representing the two process is
Answer: (d)
P-V Diagrams & Cyclic Processes
A thermodynamic system is taken through the cycle ABCD as shown in figure. Heat rejected by the gas during the cycle is
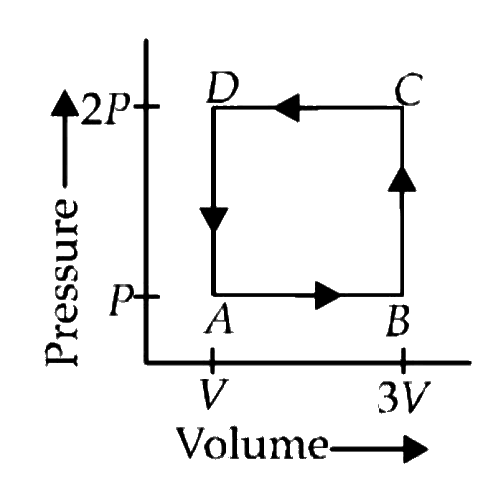
Answer: (a)
P-V Diagrams & Cyclic Processes
Two moles of helium gas are taken over the cycle as shown in the diagram.
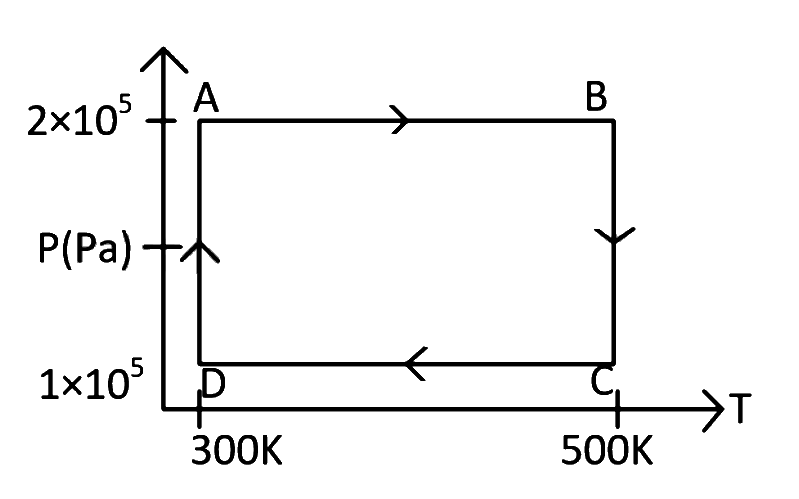
Assuming the gas to be ideal the work done on the gas in taking it from to is:
Answer: (b)
P-V Diagrams & Cyclic Processes
Two moles of helium gas are taken over the cycle as shown in the diagram.
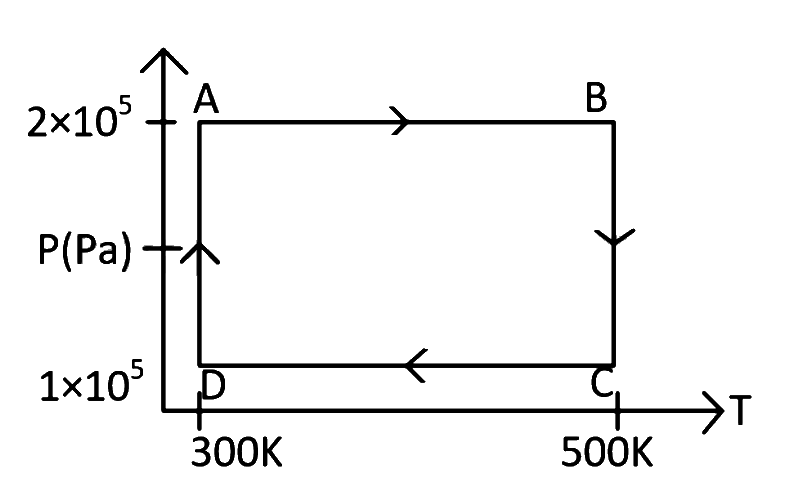
The work done on the gas in taking it from to is:
Answer: (a)
P-V Diagrams & Cyclic Processes
Two moles of helium gas are taken over the cycle , as shown in the diagram.
The net work done on the gas in the cycle is:
Answer: (a)
P-V Diagrams & Cyclic Processes
If Q, E and W denote respectively the heat added, change in internal energy and the work done in a closed cyclic process, then
Answer: (a)
P-V Diagrams & Cyclic Processes
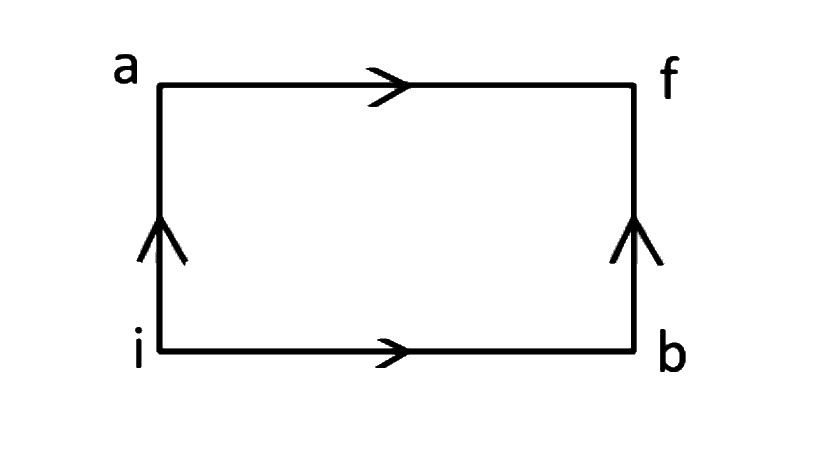
When a system is taken from state to state along the path iaf, it is found that cal and . Along the path along the path is
Answer: (b)
P-V Diagrams & Cyclic Processes
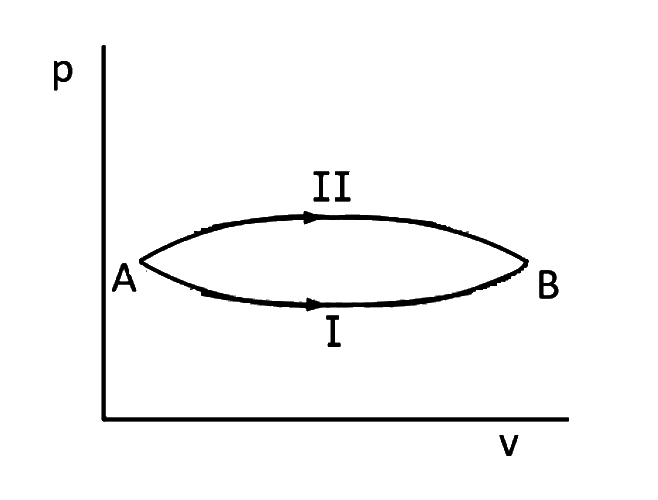
A system goes from to via two processes and as shown in figure. If and are the changes in internal energies in the processes and respectively, then
Answer: (b)
P-V Diagrams & Cyclic Processes
Which of the following is incorrect regarding the first law of thermodynamics?
Answer: (b)
P-V Diagrams & Cyclic Processes
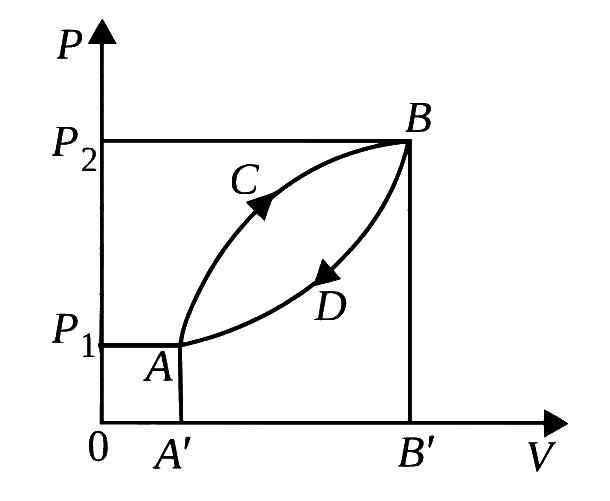
A thermodynamic system is taken from state to along and is brought back to along as shown in the diagram. The net work done during the complete cycle is given by the area
Answer: (c)
P-V Diagrams & Cyclic Processes
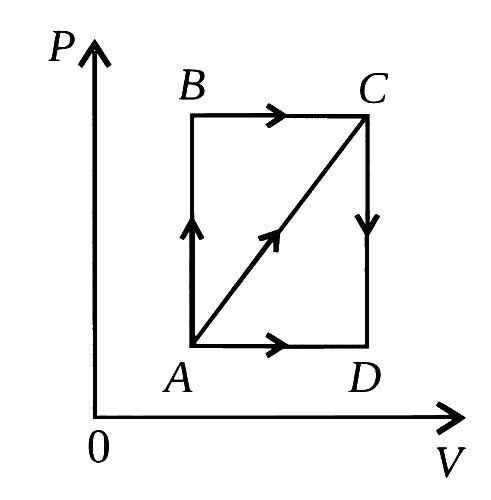
A thermodynamic process is shown in the figure. The pressure and volumes corresponding to some points in the figure are ; ; ; . In the process , 600 J of heat is added to the system and in process , 200 J of heat is added to the system. The change in internal energy of the system in process would be
Answer: (a)
No questions match these filters.